
 Home
Home News
News
- 1 The PI crypto price shows consolidation and is hovering near $30 while witnessing a selloff.
- 2 Buyers are looking to escape the 200-day EMA to regain momentum.
The PI coin price shows range-bound moves and is hovering near the 50-day EMA, reflecting selling pressure in the past sessions. Moreover, the price action displays lower low formation and a falling wedge pattern on the charts. This coin reveals a downtrend and has corrected over 30% in the last weeks. However, the 200-day EMA zone acted as a bounce region and is holding gains above $30.
The PI crypto price trades near the crucial support zone of $30. It is showing consolidation for the past sessions. Moreover, the trend is weak and sellers have persisted in pushing the coin from the highs. The trend is favoring the bears, and sellers are continuing to add short positions and are keen to stretch the down move toward the demand zone of $20.

The cryptocurrency price was $31.58 at press time, with an intraday gain of 0.69%, showing bearishness on the charts. Moreover, the trading volume increased by 25% to $281,495, highlighting selling pressure. The pair of PI/BTC was noted at 0.000664 BTC, and its market cap is $2.10 Million. Analysts are bearish and suggest that the Pi coin (PI) price will continue to extend decline. It may retest the demand zone of $20 in the following sessions.
PI Coin on Daily Charts Displays Falling Wedge Formation
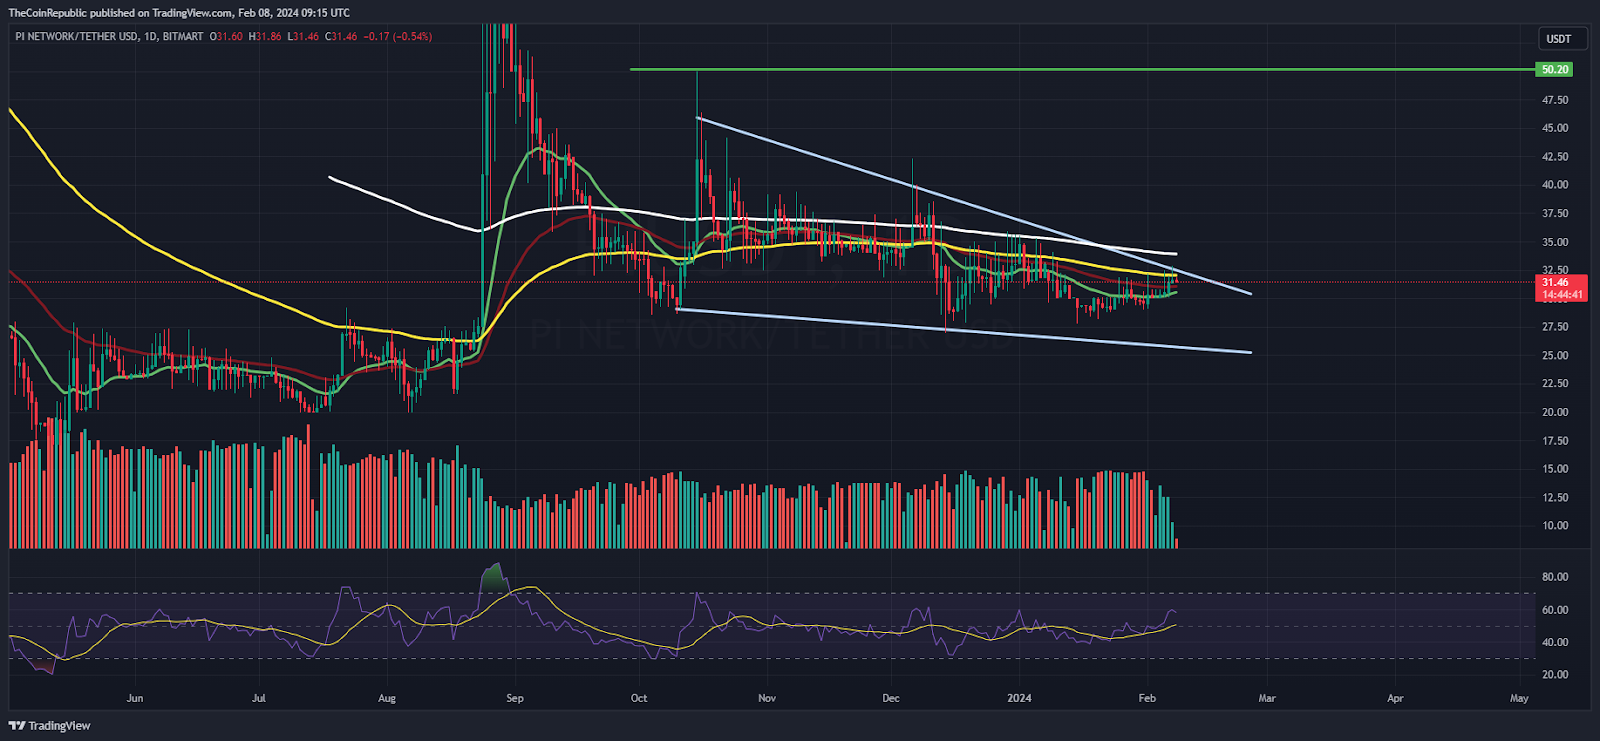
On the daily charts, the coin price shifted to the support zone of $30 and is replicating range-bound moves in the last sessions. Moreover, the coin has persisted in facing rejection multiple times from its 200-day EMA mark and is trading in the bearish region.
The Relative Strength Index (RSI) curve stays near the midline and showcases a neutral outlook on the charts. Moreover, the MACD indicator shows a bearish crossover and suggests a reversal in the following sessions. Per the Fib levels, PI crypto price is trading above the 23.6% zone and may reach 38.2% zone shortly.
PI Coin on Weekly Charts Reveals Rejection from 20-Day EMA
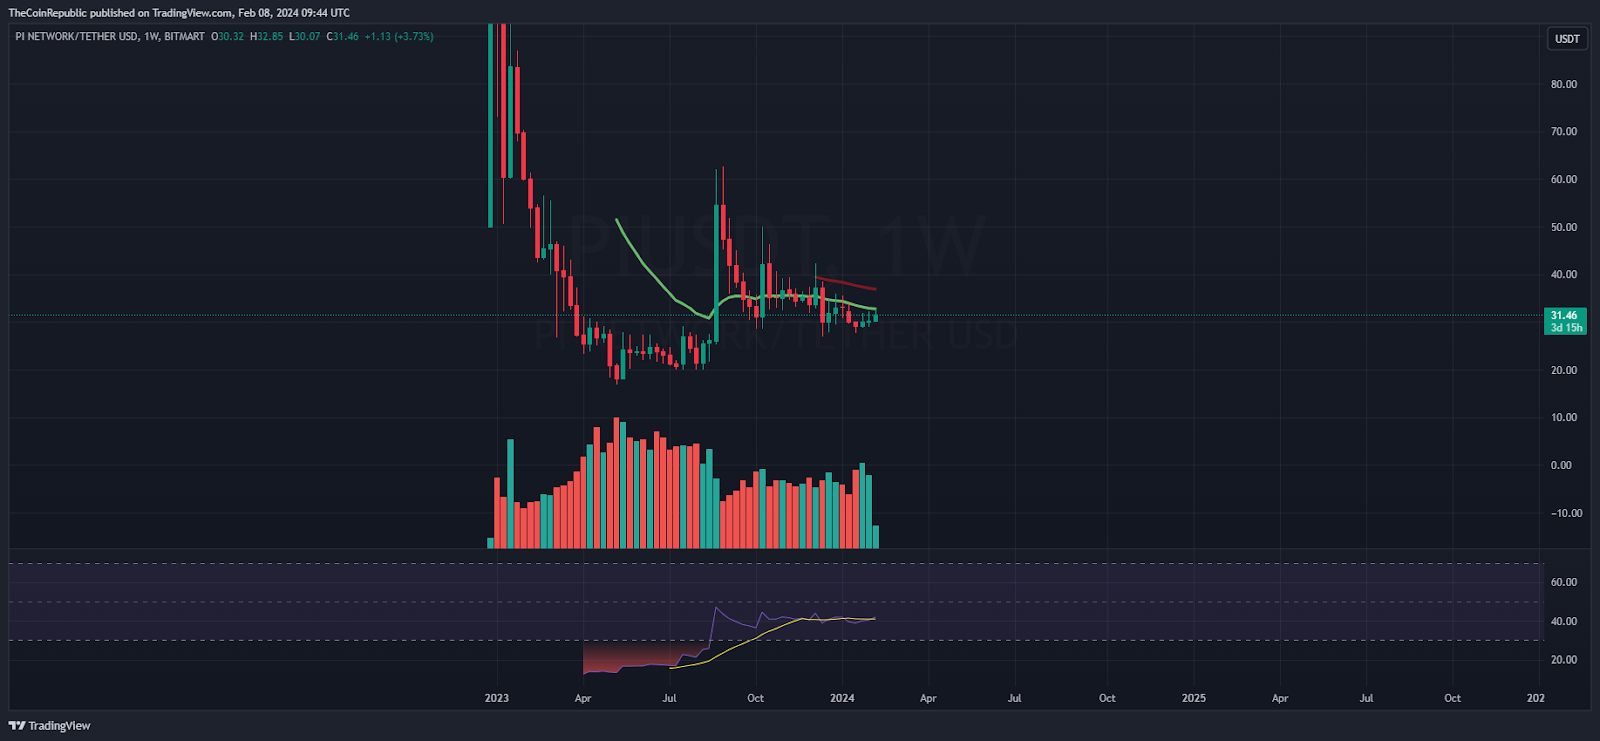
On the weekly charts, the coin price signifies a bearish momentum and is showcasing rejection from the 20-day EMA. It has been consolidating between the price bands of $30 – $40 for the past weeks, delivering lower low sequences. Furthermore, the price action conveys the sellers’ volume, indicating that sellers will likely initiate a breakdown below $25 in the following sessions.
Summary
The PI crypto shows distribution from the highs and hovers below the 200-day EMA for the past sessions. Moreover, the price action signifies the selling pressure and may drag the gains below the critical support zone of $30. Amidst the correction, the coin is ready for an up or down move in the following sessions.
Technical Levels
Support Levels: $30 and $25
Resistance Levels:34 and $37
Disclaimer
The views and opinions stated by the author or any other person named in this article are for informational purposes only and do not constitute financial, investment, or other advice. Investing in or trading crypto or stocks comes with a risk of financial loss.

Nancy J. Allen is a crypto enthusiast, with a major in macroeconomics and minor in business statistics. She believes that cryptocurrencies inspire people to be their own banks, and step aside from traditional monetary exchange systems. She is also intrigued by blockchain technology and its functioning. She frequently researches, and posts content on the top altcoins, their theoretical working principles and technical price predictions.


