
 Home
Home News
News
- 1 The Block stock price signifies roller coaster moves and has retested the 20-day EMA.
- 2 Bears have gained strength and are trying to push the price below $60.
Block stock (NYSE: SQ) price signifies a volatile move and is hovering close to its 20-day EMA mark. Recently, the stock faced rejection from the supply zone of $75 and is consolidating near $65 for the last sessions. Furthermore, the price action displays a falling channel pattern and forms a lower-low sequence, revealing sellers’ dominance. The SQ stock price directs a neutral outlook and has repeatedly retested the supply zone. If the stock succeeds in holding the 20-day EMA mark, a comeback from the bulls may redirect the stock above the bars and may glimpse $90 shortly.
The stock is trading near the neutral region and is trying to scratch the make-or-break zone of $80. It failed to surpass and displayed volatility on the charts. Recently, the stock rallied from its bottom of $40, soared over 70% in the last weeks, and is now cooling off from the highs. The up move will validate only if the stock exceeds $80; a bull run toward $90 can be anticipated.
At Wednesday’s close, the SQ stock was at $68.31 with an intraday gain of 1.96%, showing neutrality in the last session. The trading volume is 7.32 Million, and the market cap is at $41.95 Billion. Analysts are bullish and suggest a hold rating with a yearly target price of $79.76 indicates an outperform rating.
Block Stock on Daily Charts Displays Falling Channel
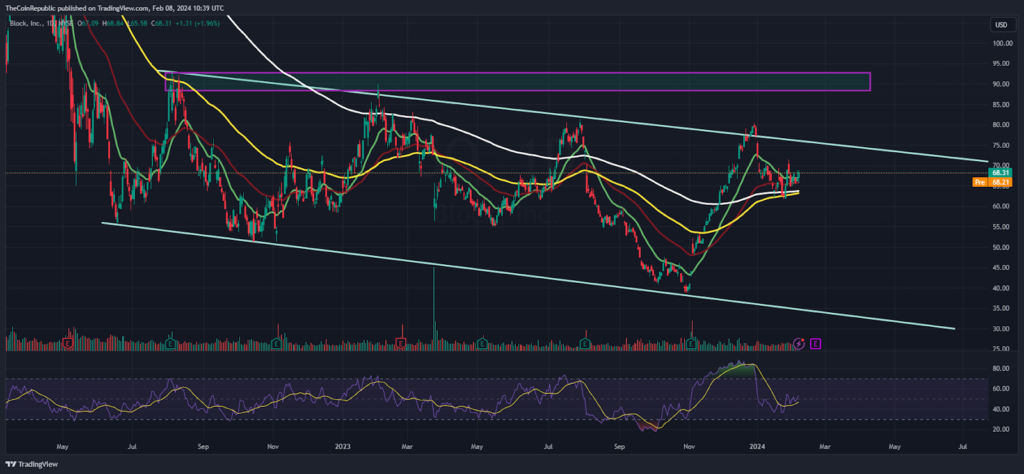
The stock tried to crack $80 multiple times on the daily charts but traded below the supply zone for the past months. This implies that mighty bears are active there and did not permit them to escape the region. Additionally, the stock has pushed from the channel upper trendline and may go to the low of $40 soon.
The Relative Strength Index (RSI) sharply falls from the overbought zone to the midline near 50 and displays a negative crossover, implying profit booking at highs. Moreover, the MACD indicator shows a bearish crossover and suggests a volatile move for the following sessions.
The SQ Stock On Weekly Charts Reveals Rejection From Supply Zone
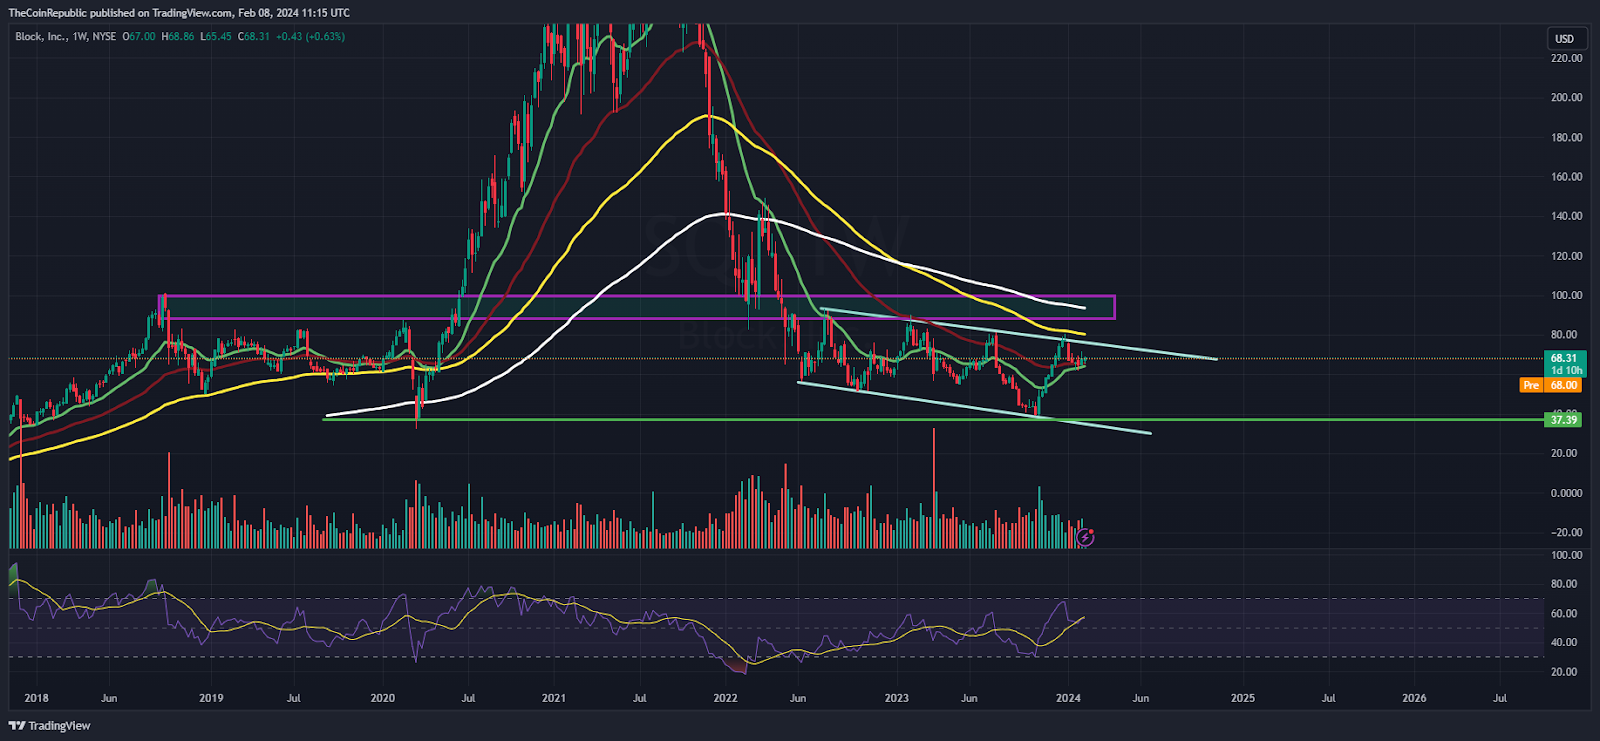
On the weekly charts, the stock has rebounded from the bottom zone of $40 and retested the 100-day EMA mark, but a throwback was witnessed. Afterward, sellers continued to push the bulls to unwind their positions, which led the stock to retrace from the highs.
Summary
The SQ stock price signifies a volatile move, displaying selling pressure in the last sessions. Moreover, the stock failed to hold the gains and faced multiple time rejections from the supply zone. Amid the recovery from the bottom, buyers could not succeed in keeping the gains and replicating weakness.
Technical Levels
Support Levels: $62 and $50
Resistance Levels:75 and $80
Disclaimer
The views and opinions stated by the author or any other person named in this article are for informational purposes only and do not constitute financial, investment, or other advice. Investing in or trading crypto or stocks comes with a risk of financial loss.

With a background in journalism, Ritika Sharma has worked with many reputed media firms focusing on general news such as politics and crime. She joined The Coin Republic as a reporter for crypto, and found a great passion for cryptocurrency, Web3, NFTs and other digital assets. She spends a lot of time researching and delving deeper into these concepts around the clock, and is a strong advocate for women in STEM.


