
The BTBT (NASDAQ: BTBT) stock has nailed the gains and made a double-bottom formation near $2.20, reciting a pullback on the charts. Moreover, the stock has terminated the correction and witnessed a hammer candlestick followed by a bullish marubozu candle, which confirms the reversal for the following sessions. However, the stock must overtake the 100-day EMA mark above $3 to acquire the buying momentum.
Bit Digital Inc. (NASDAQ: BTBT) signifies a sharp throwback from the highs of $5.25 and corrected over 50% in the last weeks. However, a sharp bounce from the lows of $2.40 was noted, which trapped the sellers. Additionally, the stock is ready to extend the rebound and may surpass $3 soon. With the rebound recorded in Bitcoin, BTBT stock and other crypto stocks outperformed the market and noted buying interest in yesterday’s session.
At Thursday’s closing, BTBT price was at $2.74, with an intraday gain of 12.76%, showing a pullback in the last session. The trading volume is at 8.65 Million and the market cap is $232.98 Million. Analysts are bullish and suggest a buy rating with a yearly target price of $5.73, suggesting an overweight rating. The stock has a return ratio of (-25.14%), whereas (+ 85.14%) on a yearly basis.
BTBT on Daily Charts Displays Double Bottom Formation
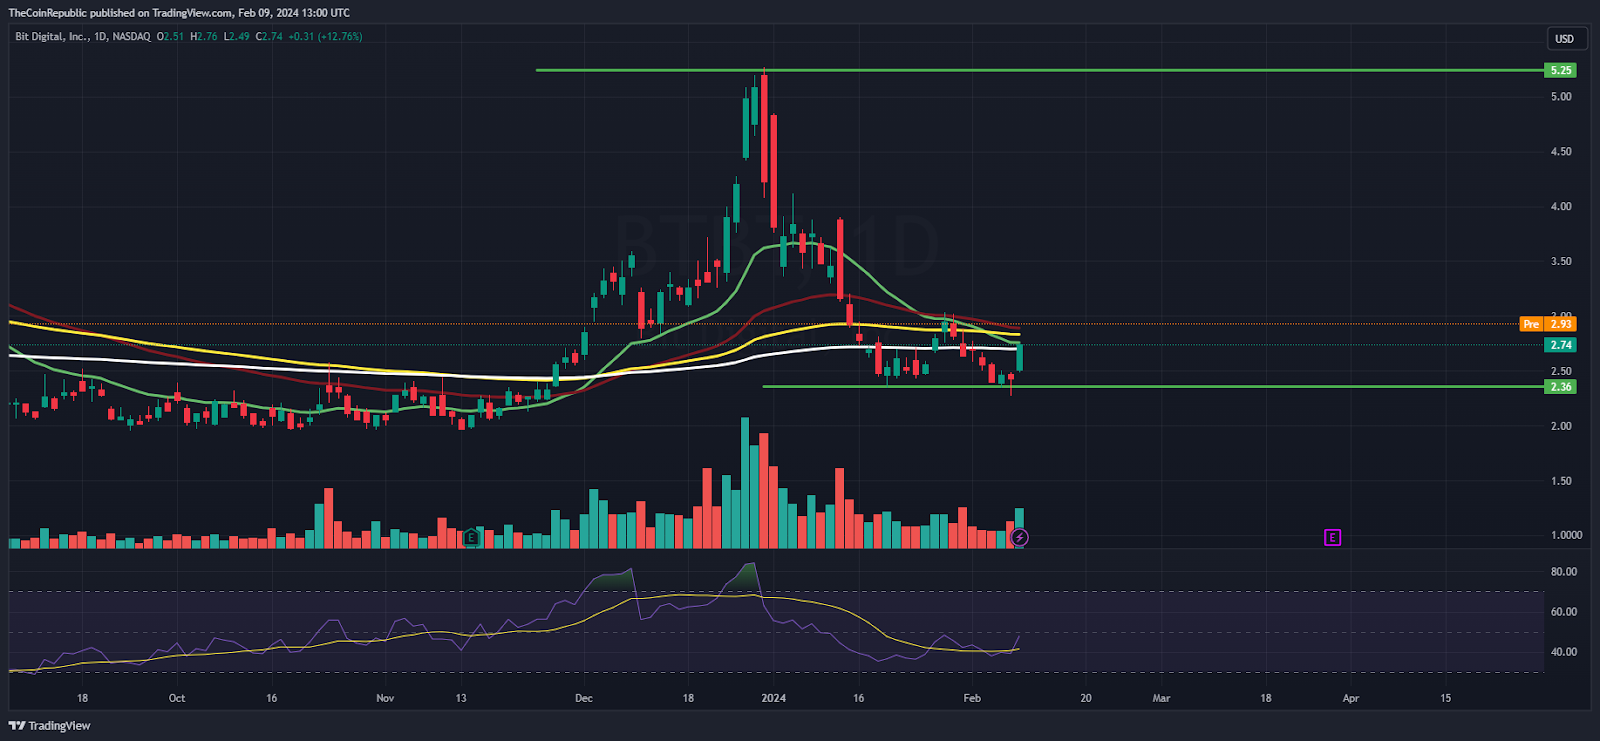
On the daily charts, the stock noted a sharp surge and climbed over 12%, glimpsing a bullish reversal pattern. Moreover, the stock noted a gap of 7% during the pre-market session and may continue to rebound in the upcoming sessions. The stock has done its correction and may acquire strength above $3 soon. The option chain data indicates a massive increase in open interest of 23% to 2058 hundred shares at the put side, signifying the short-covering move.
The Relative Strength Index (RSI) curve sharply rose from the overbought zone and reached the neutral zone, indicating the short covering move. Moreover, the MACD indicator shows a bullish crossover and noted a reversal from the lows.
BTBT on Weekly Charts Exhibits Cup and Handle Formation
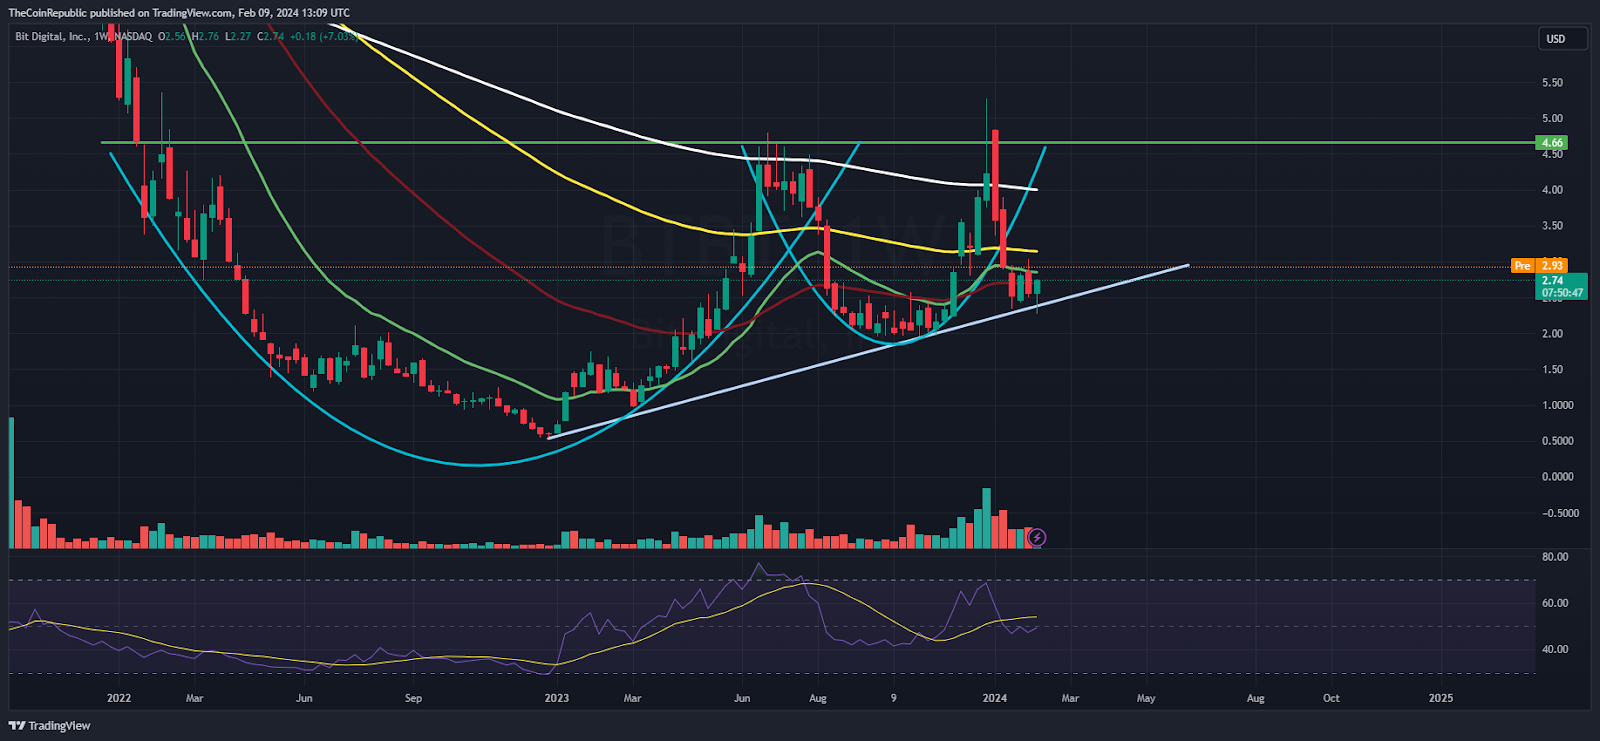
On the weekly charts, the BTBT stock noted a cup and handle pattern but failed to register a breakout above the supply zone of $5.50 and pushed toward its demand zone. Meanwhile, the stock took support on its upward trendline near $2.10 and formed a hammer candlestick, which signifies the reversal for the coming sessions.
Summary
Bit Digital Inc. (BTBT) stock noted a base formation and is ready to sparkle the gains amidst the correction from the highs. The stock is ready for a bounceback and may acquire bullishness above the prompt hurdle of $3, which may trigger the upward move toward $4 in the following sessions.
Technical Levels
Support Levels: $2.30 and $2
Resistance Levels:$3 and $3.20