
 Home
Home News
News
- 1 The BTC coin showed a rebound and witnessed buyers’ accumulation on the charts.
- 2 Bulls have regained momentum and are setting their vision to climb $50,000.
Bitcoin price recites buying momentum and is glad to take off the gains above its prompt hurdle of $48,000, placing eyes to catch $50,000 soon. Bitcoin (BTC) has just obtained support at the 100-day EMA region and mirrors a reversal. Moreover, the coin was in an uptrend and poised to advance gains in the following sessions. This week, optimistic news was floated into the market that Thailand has removed the VAT on cryptocurrency trading, which was imposed around 7% earlier, triggering the crypto market’s bullishness.
The BTC price trades in the bullish trajectory and is above the significant moving averages, replicating the bullishness. Moreover, the chart displays the formation of three white soldiers, which suggests that the bounce is reliable and Bitcoin may continue to outperform in the following sessions. If Bitcoin triggers above $47,000, it may ascend around 8% to $50k soon.
The Bitcoin (BTC) price was $46463.45 at press time, with an intraday gain of 3.98%, showing bullishness on the charts. Moreover, the trading volume increased by 17.24% to $26.33 Billion, highlighting the buying momentum. Its market cap is $910.68 Billion. Analysts are bullish and suggest that the Bitcoin (BTC) price will continue to extend upside. It may retest the round mark of $50,000 in the following sessions.
BTC on Daily Charts Displays Pullback from the 100-Day EMA
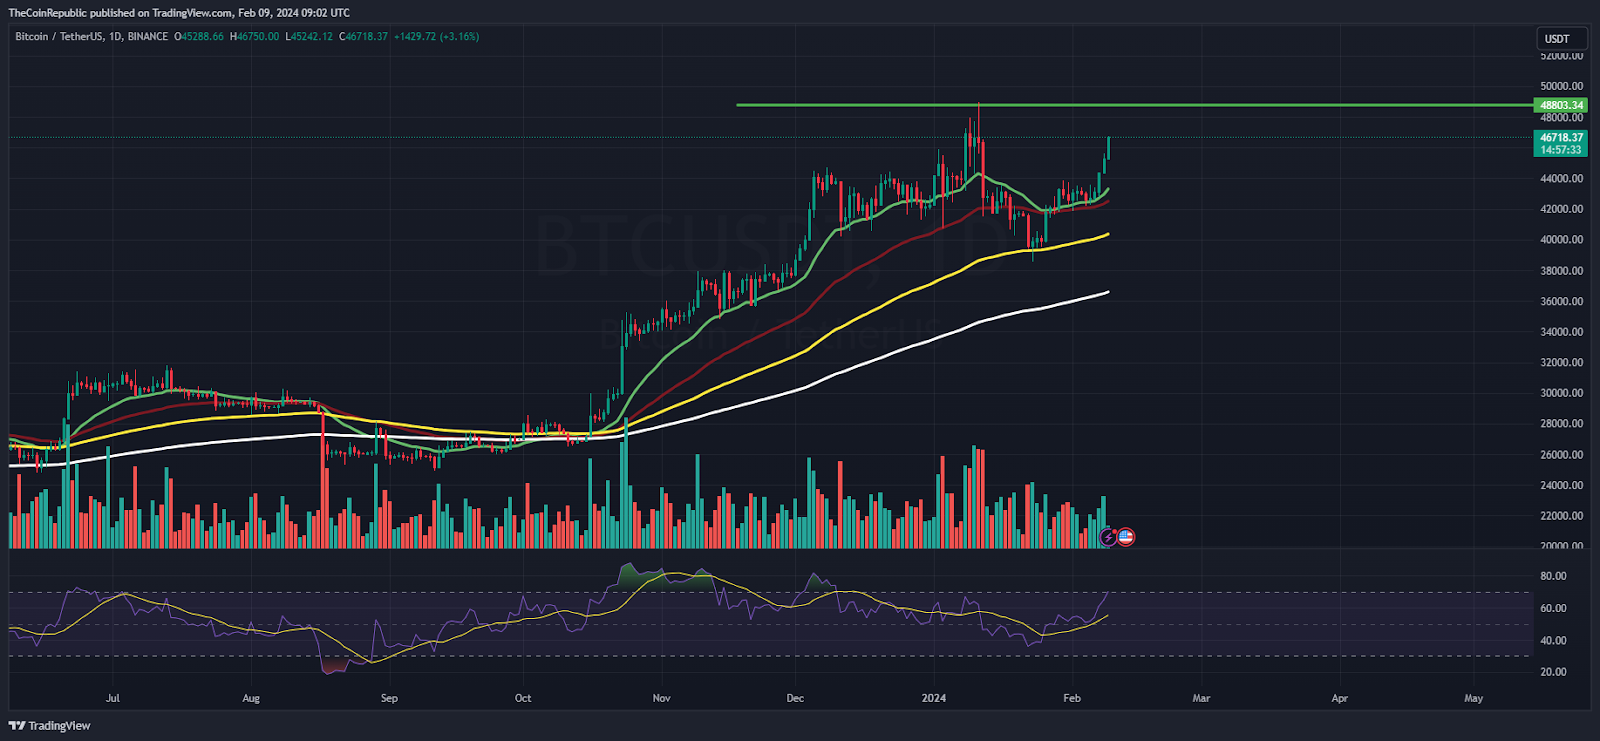
On the daily charts, Bitcoin price saw bullish momentum, gaining traction above the 20-day EMA mark and accelerating toward $47,000. Moreover, the price action shows a rounding bottom formation and replicates bulls’ dominance. Sellers now appear trapped and are covering their positions, which may carry forward the upmove.
The Relative Strength Index (RSI) curve stays in the overbought zone and has initiated a buy signal for the following sessions. Moreover, the Moving Average Convergence Divergence (MACD) indicator reveals a bullish crossover. The green bars formed on the histogram suggest a bullish outlook for the following sessions.
The BTC Price on Weekly Charts Displays Rounding Bottom Formation
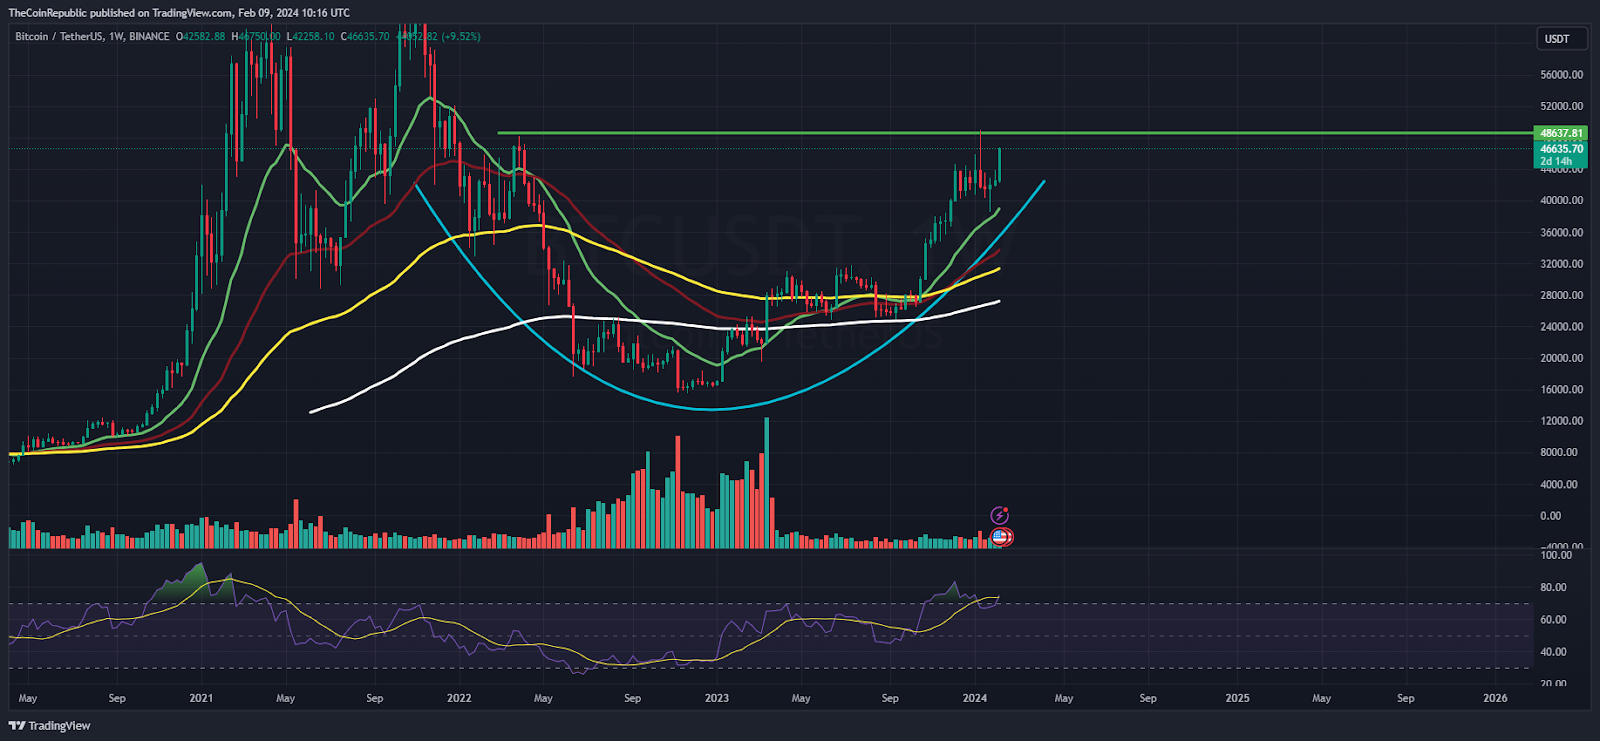
On the weekly charts, the BTC price recovered over 70% in the past few weeks and displayed a rounding bottom formation. Moreover, the price action signified the higher highs formation and glimpsed an uptrend for the past sessions. Per the Fibonacci retracement levels, the price trades above the 61.8% zone and may skyrocket the gains in the upcoming sessions.
Summary
The Bitcoin price showcased a rebound and is ready to glimpse $50k in the upcoming sessions. Moreover, the trend is intact. The buyers have persisted in accumulation and are setting their vision to crack the upside toward $48000 followed by $50,000 in the following sessions.
Technical Levels
Support Levels: $46400 and $46000
Resistance Levels:$ 46700 and $46900
Disclaimer
The views and opinions stated by the author or any other person named in this article are for informational purposes only and do not constitute financial, investment, or other advice. Investing in or trading crypto or stocks comes with a risk of financial loss.

Adarsh Singh is a true connoisseur of Defi and Blockchain technologies, who left his job at a “Big 4” multinational finance firm to pursue crypto and NFT trading full-time. He has a strong background in finance, with MBA from a prestigious B-school. He delves deep into these innovative fields, unraveling their intricacies. Uncovering hidden gems, be it coins, tokens or NFTs, is his expertise. NFTs drive deep interest for him, and his creative analysis of NFTs opens up engaging narratives. He strives to bring decentralized digital assets accessible to the masses.


