
 Home
Home News
News
- 1 The LTC coin showcases range-bound movements and is hovering below the 200-day EMA.
- 2 Buyers are trying to surpass the hurdle and are looking to soar the gains.
The Litecoin price signifies consolidation in a narrow range and is hovering between $65 and $80 for the past sessions. Moreover, the investors are worried about the uncertain moves and awaiting an up move to book their gains amidst the neutral price action. However, the coin may acquire momentum above the 200-day EMA hurdle but needs to cross the trendline hurdle of $73 to gain strength. Additionally, a symmetrical triangle pattern was displayed, and the coin price was close to the upper trendline. It might succeed in breaching soon.
The LTC price is trading near the neutral region of $70 and has been showing a dilemma for a while. The bulls and bears are also trying to gain momentum, but indecisiveness was witnessed in the past sessions. Buyers must lift the price above $74 to attain strength, whereas sellers need to stretch below $65 to push toward $50. Amid the market reversal, the Litecoin price did not impact and stayed in a narrow range, drawing low investor interest.
This cryptocurrency price was $70.55 during the press time, with an intraday gain of 2.62%, showing neutrality on the charts. Moreover, the trading volume increased by 48.36% to $420.24 Million, highlighting buying momentum. The market cap is $5.19 Billion. Analysts are bullish and suggest that the Litecoin (LTC) price will retain strength and may outperform in the following sessions.
The LTC Price on Daily Charts Exhibits Symmetrical Triangle Formation

On the daily charts, the Litecoin price persisted in facing rejection from the 200-day EMA and stays below it, glimpsing neutrality. Moreover, the price action showed consolidation. The bulls did not lose their strength and held the gains above the 38.2% Fibonacci zone, which signifies strength on the charts. Additionally, the bears failed to push it below the neckline of $60, which indicates that the trend is intact and a short covering move may trigger soon.
The Relative Strength Index (RSI) curve zooms above the midline and is heading to the overbought zone, suggesting a favorable bullish outlook for the following sessions.
The MACD indicator shows a bullish crossover, and the green bars formed on the histogram suggest a breakout for the following sessions.
Litecoin on Weekly Charts Displays Rejection From the 50-Day EMA
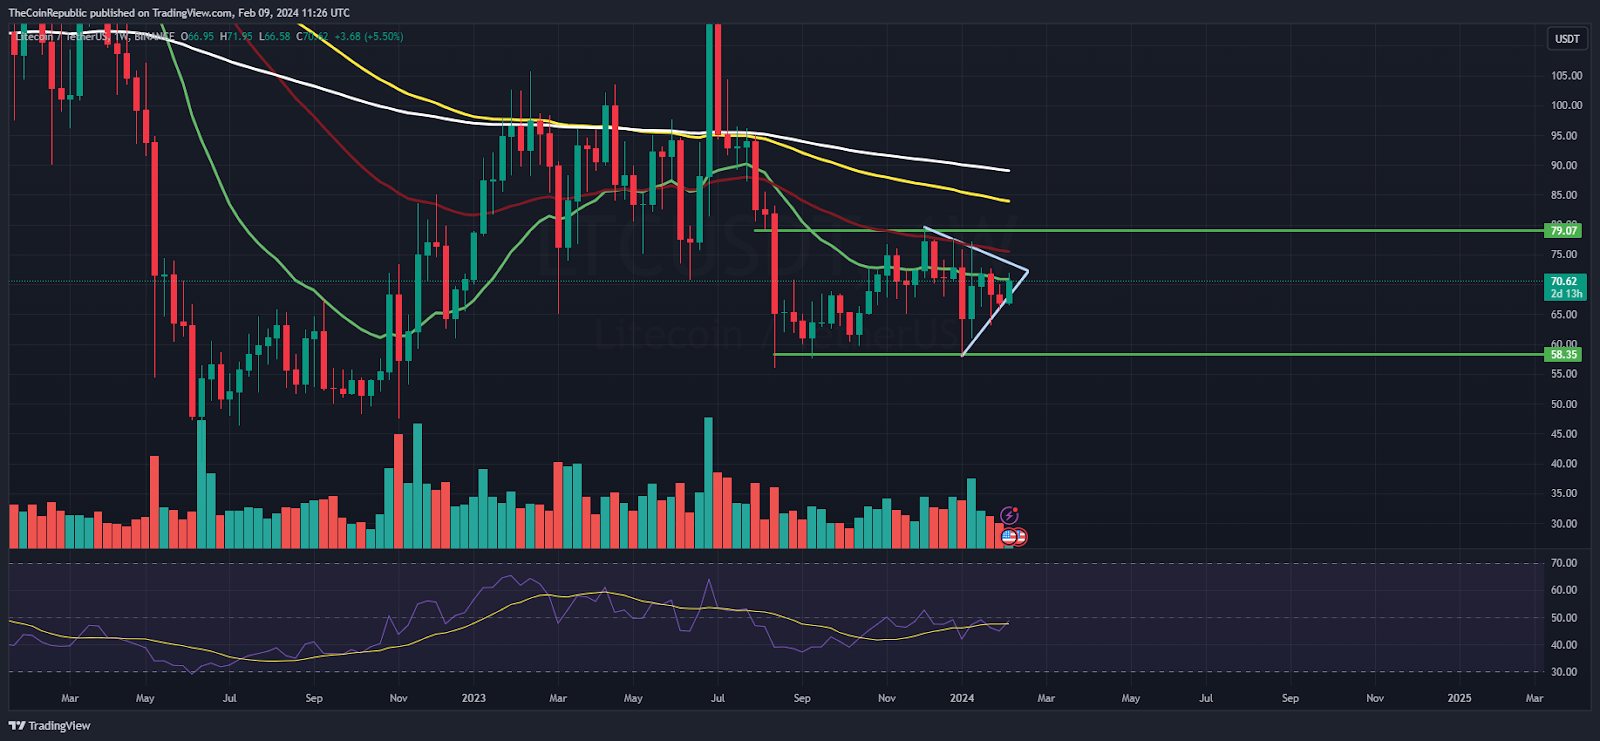
On the weekly charts, the Litecoin (LTC) price was trading below the 50-day EMA for a long time. It is persisting in facing rejection, which reveals a strong resistance zone that bulls failed to sustain amid several attempts. However, the bulls did not let it go back; they stayed close to the 20-day EMA and displayed range-bound moves.
Summary
Litecoin price is trading near the 100-day EMA mark and is ready for a pullback above $72 in the following sessions. Bulls are gaining traction and are preparing for an up move above the trendline hurdle of $75 to acquire bullishness. Furthermore, the trend is intact and the LTC price may rise to $80 soon.
Technical Levels
Support Levels: $68 and $65
Resistance Levels:$74 and $78
Disclaimer
The views and opinions stated by the author or any other person named in this article are for informational purposes only and do not constitute financial, investment, or other advice. Investing in or trading crypto or stocks comes with a risk of financial loss.

Amanda Shinoy is one of the few women in the space invested knee-deep in crypto. An advocate for increasing the presence of women in crypto, she is known for her accurate technical analysis and price prediction of cryptocurrencies. Readers are often waiting for her opinion about the next rally. She is a finance expert with an MBA in finance. Quitting a corporate job at a leading financial institution, she now engages herself full-time into financial education for the general public.


