
 Home
Home News
News
- 1 The Sandbox price prediction demonstrates the bullishness in the upcoming sessions.
- 2 SAND/USD is trying to break above the key moving averages and bounce back.
- 3 Crypto price rose by approximately 4.85% in the previous week, showcasing bullishness.
The Sandbox Crypto (USD/SAND) is showcasing strength and heading towards the upper levels. The positive trend indicates that an upward move for SAND Crypto toward the expected target of $0.63563304 is possible. Therefore, the bulls are likely to sustain the long positions. The Sandbox Crypto is trading above major moving averages, indicating a bullish outlook on the technical chart.
Moreover, chart structures based on recent trading sessions are in favor of bulls. The crypto has gained momentum and is poised for an uptrend that could reach upper levels by making higher high structures. The increased bullishness and momentum also support the positive outlook of market bulls.
At the time of publication, the Sandbox Crypto was trading at $0.46006457 with an intraday gain of 1.96%, showing positive sentiment and a bullish outlook on the technical charts. Additionally, the intraday trading volume was 91.34 Million and the market capitalization was $1.03 billion.
Moreover, as buying volume advances, the price can make higher highs structure to maintain bullish momentum. Therefore, The Sandbox price is expected to move higher and remain strong on the daily chart.
Technical Analysis of the Sandbox Crypto Price on the Daily Timeframe
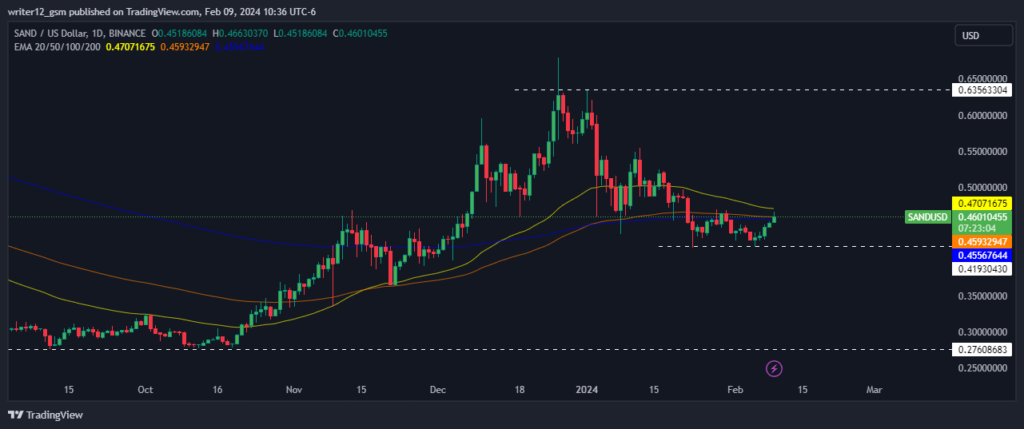
At the moment, the Sandbox Crypto (USD: SAND) price is trading above its 100-day and 200-day exponential moving averages (EMA), which supports the price direction.
The current RSI curve value is 51.44 points. The 14 SMA is above the midline at 42.02 points, indicating a positive trend for the Sandbox Crypto. The MACD line at -0.01228762 and the signal line at -0.01635557 are above the zero line.
There is a bullish crossover on the MACD indicator, which indicates strength in the price movement of the SAND cryptocurrency.
Technical indicators also support the bullish sentiment as RSI is close above the middle line and MACD has formed a bullish crossover with the green bars. These signals indicate that the cryptocurrency could face even good upward pressure in the coming weeks.
Summary
The Sandbox (USD: SAND) Technical oscillator and indicators support the bullish trend on the daily technical chart. MACD, RSI, and EMA highlight positive signals and suggest that the upward trend in SAND Crypto price may continue. Price action suggests that investors and traders are optimistic on a daily basis. Price movements reflect the current optimistic outlook.
Technical Levels
Support Levels: The Sandbox Crypto price may find support at $0.41930430, where it could bounce back or stabilize.
Resistance levels: The SAND Crypto price may face resistance at $0.63563304, where it could reverse or consolidate.
Disclaimer
This article is for informational purposes only and does not provide any financial, investment, or other advice. The author or any people mentioned in this article are not responsible for any financial loss that may occur from investing in or trading. Please do your own research before making any financial decisions

Adarsh Singh is a true connoisseur of Defi and Blockchain technologies, who left his job at a “Big 4” multinational finance firm to pursue crypto and NFT trading full-time. He has a strong background in finance, with MBA from a prestigious B-school. He delves deep into these innovative fields, unraveling their intricacies. Uncovering hidden gems, be it coins, tokens or NFTs, is his expertise. NFTs drive deep interest for him, and his creative analysis of NFTs opens up engaging narratives. He strives to bring decentralized digital assets accessible to the masses.


