
 Home
Home News
News
- 1 The Bitcoin price is near the 50K mark, raising the excitement among investors and traders.
- 2 BTC’s technical chart is also strong as the bulls have a tight grip on the price.
- 3 The price grew by almost 13.39% this week, showcasing the bulls’ dominance in the market.
Bitcoin is back in the game with a powerful surge in the price and spreading the pessimistic outlook in the market. The price has surged by almost 13.39% this week and the spot ETF approval is now paying off.
The rally in the bitcoin price is directly correlated to the launch of US exchange-traded funds (ETFs), as per the reports. ETFs added a remarkable investor inflows of $9 billion.
Experts and analysts are bullish on Bitcoin in 2024, estimating a long-term demand range of $40 billion to $130 billion. The BTC ETF opens the door to global wealth and brings cash flow into the crypto space.
Bitcoin Giving a Spectacular Performance
Bitcoin gave a spectacular performance over the year, giving a return of 120.72% over the last year. Since the beginning of the year, it has provided a positive return of 14.22%, and in the previous 6 months, it has given a return of 65.46%. In the last 3 months, it grew by almost 32.33%, and last month, it grew by 12.85%, showcasing buyers are highly bullish on the BTC.
At the time of writing Bitcoin is trading at $48,005 with an intraday drop of 0.20% with a 24-hour volume of 19.15 billion. It has a fully diluted market cap of 1.01 Trillion.
As per the BTC/USD technical summary of the trading view, the trend in the BTC price is bullish. Moreover, out of 26 indicators, 5 are on the sell side. 7 are on neutral, and 14 are on the buy-side, demonstrating the buying side’s dominance.
Technical Analysis of Bitcoin Price on the Daily Timeframe
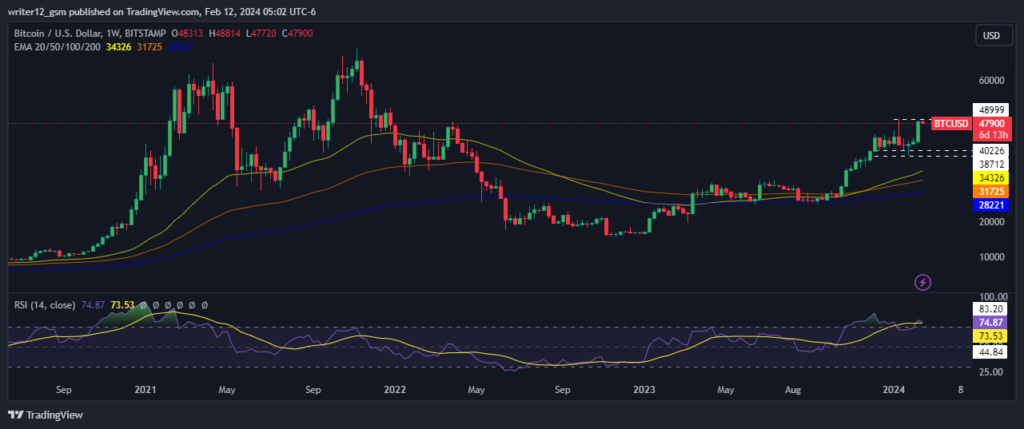
Bitcoin price analysis demonstrates the bullishness in the price as bitcoin is showing a vertical rally on the daily technical charts. The price surged by almost 12.43% this week, and now it is trying to cross its previous high of $49048 and reach the psychological level of 50K.
Analysts and indicators are bullish on the BTC, and buying activity is also seen recently, which increases the probability of achieving 50K in the upcoming sessions.
The price is currently trading above the key moving averages, showcasing bullishness. The RSI curve is near 70.88 in the overbought zone, demonstrating bullishness. The MACD also shows a clear bullish sign hovering in the positive zone.
Conclusion
Bitcoin price is close to the 50K mark, a crucial level that could determine the future direction of the crypto market. Bitcoin has shown a strong performance in the past year, driven by the launch of US exchange-traded funds (ETFs), the anticipation of the halving event, and the positive sentiment in the global market.
Bitcoin’s technical chart is also bullish, as the price is trading above the key moving averages, the RSI is in the overbought zone, and the MACD is in the positive zone.
Disclaimer
This article is for informational purposes only and provides no financial, investment, or other advice. The author or any people mentioned in this article are not responsible for any financial loss that may occur from investing in or trading. Please do your research before making any financial decisions.

Andrew is a blockchain developer who developed his interest in cryptocurrencies while pursuing his post-graduation major in blockchain development. He is a keen observer of details and shares his passion for writing, along with coding. His backend knowledge about blockchain helps him give a unique perspective to his writing skills, and a reliable craft at explaining the concepts such as blockchain programming, languages and token minting. He also frequently shares technical details and performance indicators of ICOs and IDOs.


