


Stellar crypto faced a sharp throwback from the highs of $0.1350 and noted a triple top formation, which led to correction from the highs and declined over 20% in the last sessions. Moreover, the trend is bearish, and buyers must stretch the gains beyond the prompt hurdle of $0.1200 to flip the momentum amidst the correction. However, the downward-sloping trendline was breached, which suggests that bulls will try to lift Stellar crypto toward $0.1300 soon.
Stellar crypto price trades in the bearish trajectory and depicts a breakdown in the past sessions. However, the correction may end, and a rebound may be witnessed shortly above the 50-day EMA mark. Bulls must hold the demand zone of $0.1000 to prevent any downside and accumulate the gains to revert the trend.
The Stellar price (XLM) was $0.1128 at press time, with an intraday gain of 2.15%, showing neutrality on the charts. Moreover, the trading volume increased by 19.28% to $76.33 Million, highlighting the reversal. The pair of XLM/BTC is at 0.00000226 BTC, and the market cap is $2.30 Billion. Analysts are neutral and suggest that the Stellar (XLM) crypto price will retain strength and may lift the gains above $0.1200 soon.
XLM on Daily Charts Witnessed Rebound From Demand Zone
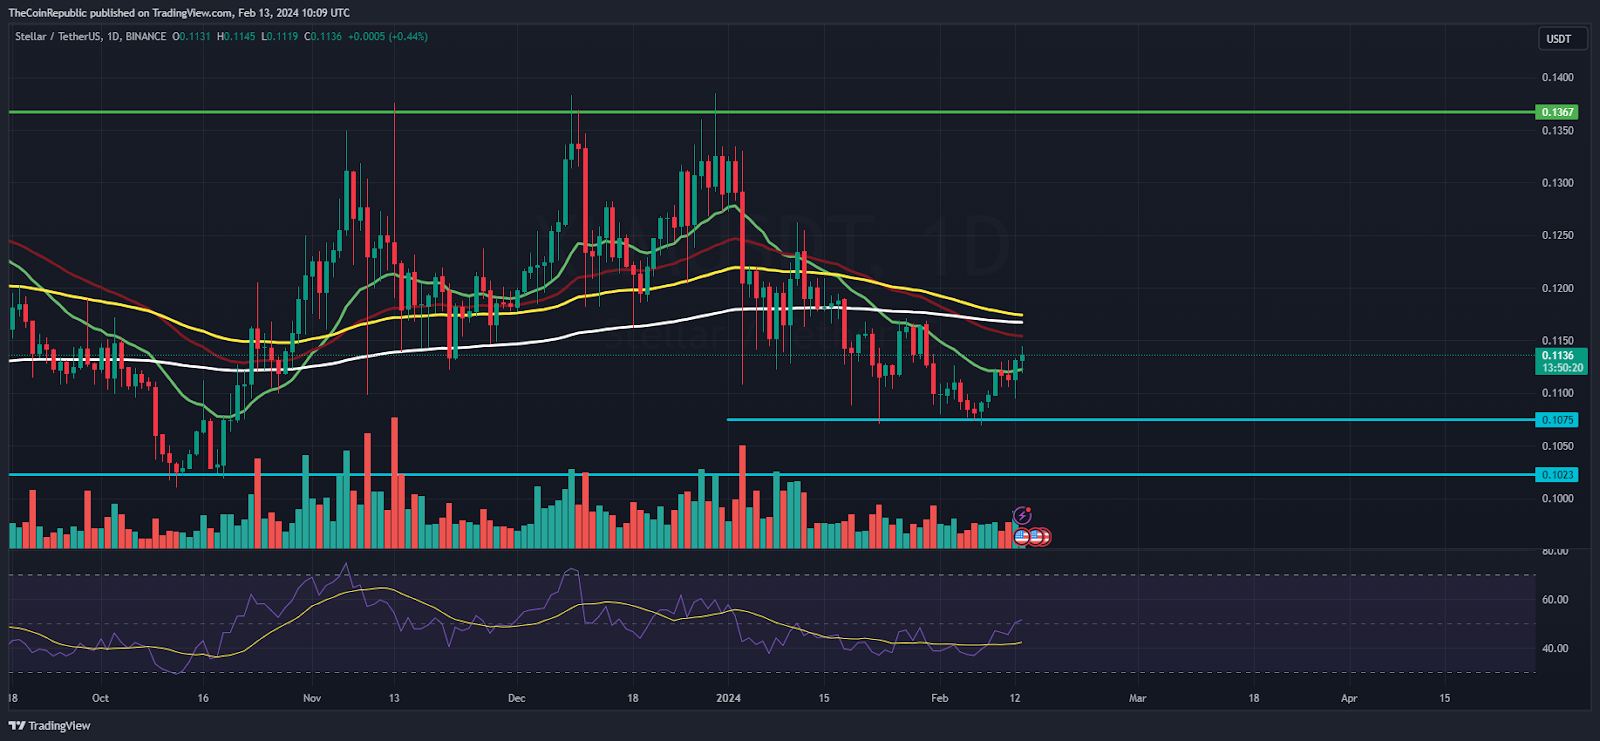
On the daily charts, the XLM price showcased a bounce from the support region of $0.1000, fetched the 20-day EMA mark, and is headed to retest the 50-day EMA mark. However, the sellers are still attempting to push the XLM crypto below $0.1000 to extend the downside. Per the Fibonacci retracement zone, XLM price has sustained the 23.6% zone and noted a rebound.
The Relative Strength Index (RSI) curve stays below the midline and shows a negative divergence, implying the bearishness for the past sessions. Moreover, the MACD indicator shows a bullish crossover and suggests that the buyers may stretch the rebound toward the $0.1200 mark soon.
XLM on Weekly Charts DIsplays Rejection From 50 Day EMA
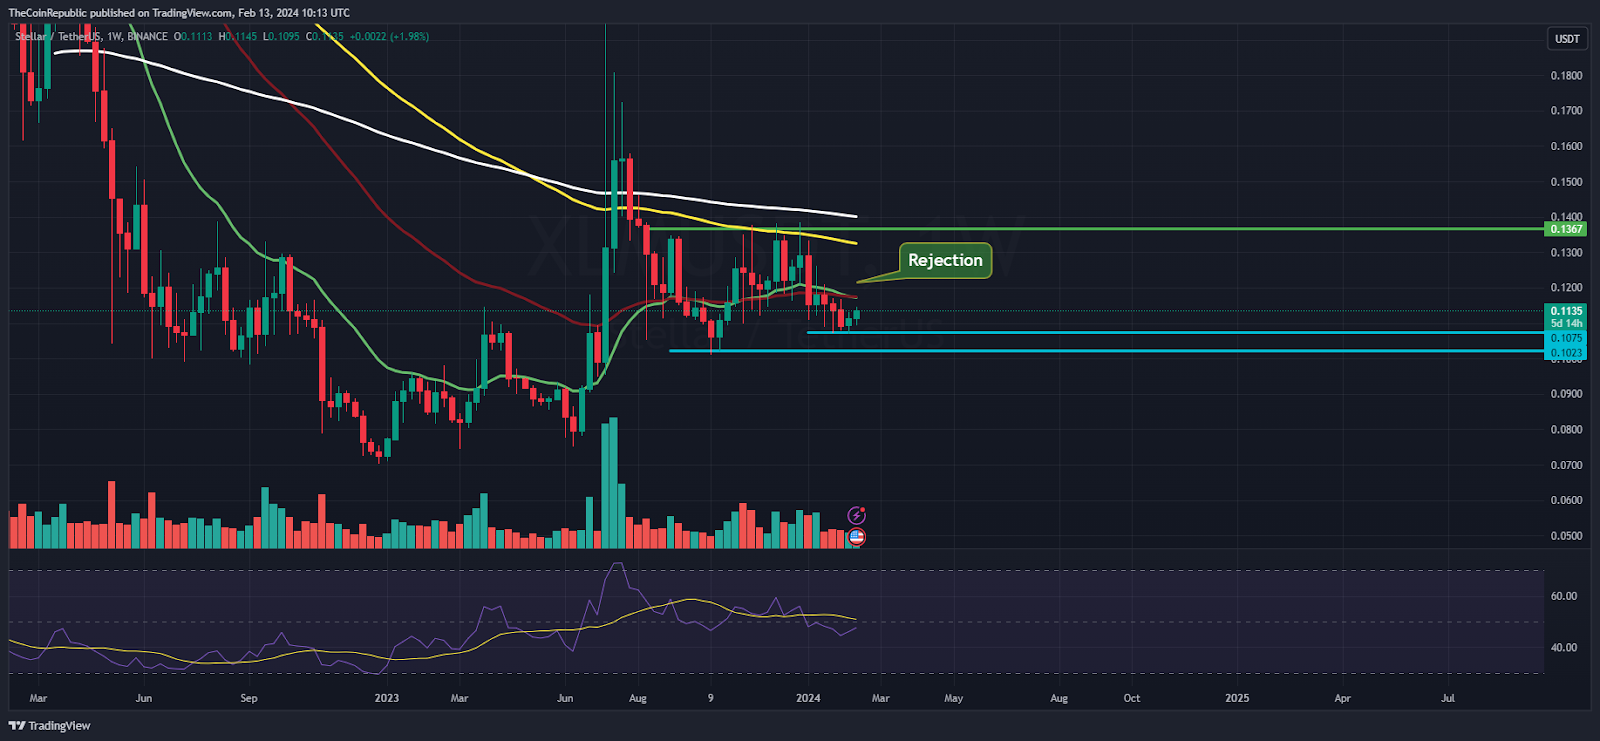
On the weekly charts, the Stellar crypto price was in a range and persisted in facing rejection from the 50-day EMA mark. However, the XLM price managed to hold the gains and did not witness any sharp fall, which signifies neutrality. A bottom formation was revealed near the low of $0.1000. If it is not breached, XLM crypto will attempt a bounce and may soon redirect the gains to $0.1200.
Summary
Stellar (XLM) price stays in the bearish trajectory and signifies a rebound from the support zone of $0.1000, but needs to surpass the 50-day EMA mark above $0.1200 to attain buying momentum. Moreover, the price action signifies bear dominance, and XLM price needs to escape $0.1300 to achieve a bullish rally.
Technical Levels
Support Levels: $0.1000 and $0.0900
Resistance Levels:$0.1200 and $0.1500


