
 Home
Home News
News
- 1 Mantle crypto price is currently trading at $0.69501856 with a nominal rise of 0.02% in the last 24 hours with a market cap of $2.24 Billion./a>
- 2 Mantle crypto price increased by 16.36% over the past seven days.
- 2 MNT price broke above the 50 and 200-Day EMAs, showcasing bullishness on the daily charts.
Mantle crypto forecast demonstrates the bullishness on the daily technical chart breaking above the key moving averages. The buyers have been aggressive in the last few trading sessions.
Over a week, Mantle crypto has experienced a gain of approximately 16.36%, and this incline has been recovering the downfall of last month. Looking back over the last three months, Mantle crypto gained around 51.10%, and it extends to around 61.49% over the last six months. Furthermore, the crypto’s performance throughout the year has been good, with a year-to-date gain of approximately 8.06%.
At press time, the Mantle crypto price was $$0.69501856, with an intraday rise of 0.02%, showing mild bullishness on the charts intraday. Moreover, the trading volume is $182.57 Million. The market cap is $2.24 Billion. TradingView indicators are showing a buy rating, suggesting a bullish outlook for the coming sessions.
Technical Analysis of Mantle Crypto Price in 1-D Timeframe
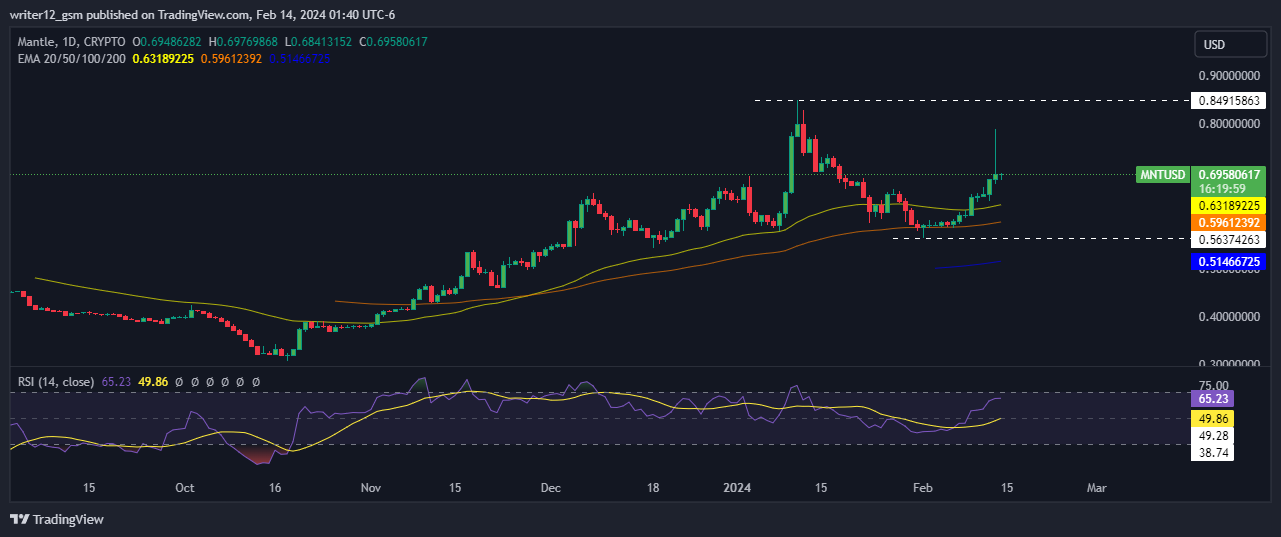
Mantle (USD: Mantle) crypto price rose steadily for the past three months making a higher highs structure, gaining 51.25%. At the time of writing, Mantle crypto was trading in the bullish zone and has been trying to hold on to this level after a pullback.
If the momentum continues, the Mantle price could continue to go up and reach new targets. However, if the Mantle price falls, then it might hit the closest dynamic support levels.
At press time, Mantle crypto (USD: Mantle) was trading above the 50 and 200-Day EMAs (Exponential moving averages), which are reflecting a bullish trend.
Moreover, if the selling volume increases, then the price action could produce a lower-lows structure. However, the probability of bearish moves is low as the price is trading with extreme bullish momentum.
Hence, the Mantle price is expected to move upwards giving a bullish outlook over the daily time frame chart.
The current value of RSI is 65.38 points. The 14 SMA is above the median line at 49.87 points which indicates that the Mantle crypto is bullish.
The MACD line at 0.00937211 and the signal line at -0.0027025 are above the zero line. A bullish crossover is observed in the MACD indicator which signals more bullishness for the Mantle crypto price.
Summary
Mantle (USD: Mantle) technical indicators are signaling a bullish trend. The MACD, RSI, and EMA are highlighting bullishness and suggest that the positive trend may continue in the Mantle crypto price chart. Moreover Mantle crypto can go high if it gets the desired support from more buyers. At this stage, MNT needs more buyers to reach new levels.
Technical Levels
Support Levels: $0.63187628 and $0.59611588
Resistance Levels: $0.78899231 and $0.84915863
Disclaimer
This article is for informational purposes only and does not provide any financial, investment, or other advice. The author or any people mentioned in this article are not responsible for any financial loss that may occur from investing in or trading. Please do your own research before making any financial decisions.

With a background in journalism, Ritika Sharma has worked with many reputed media firms focusing on general news such as politics and crime. She joined The Coin Republic as a reporter for crypto, and found a great passion for cryptocurrency, Web3, NFTs and other digital assets. She spends a lot of time researching and delving deeper into these concepts around the clock, and is a strong advocate for women in STEM.


