
 Home
Home News
News
- 1 The RNDR token signified renewed bullish momentum and topped the $5 mark.
- 2 Buyers have gained traction and persisted in accumulation.
The Render token glimpses bullishness and depicts a rounding bottom formation. The bulls are eyeing the neckline, which exists near $5.230. Moreover, the price action conveys the pullback from the 100-day EMA, which trapped the sellers. Additionally, the token continued to form the higher high swings and delivered the buying interest on the charts.
RNDR token escaped the key moving averages and reached the bullish territory, delivering the bulls’ dominance for the past sessions. The token signifies the follow-on buying momentum, and investors have continued adding their long positions. It led to a rise of over 40% this month, delivering institutional buying cues.
The Render token (RNDR) price was $5.07 at press time, with an intraday gain of 12.15%, showing bullishness on the charts. Moreover, the trading volume increased by 176.28% to $189.10 Million, highlighting the buying momentum. The pair of RNDR/BTC is at 0.000102 BTC, and the market cap is $2.71 Billion. Analysts are bullish and suggest that the Render (RNDR) crypto price will continue to extend gains and may lift the gains above $6 soon.
RNDR On Daily Charts Displays Rounding Bottom Formation
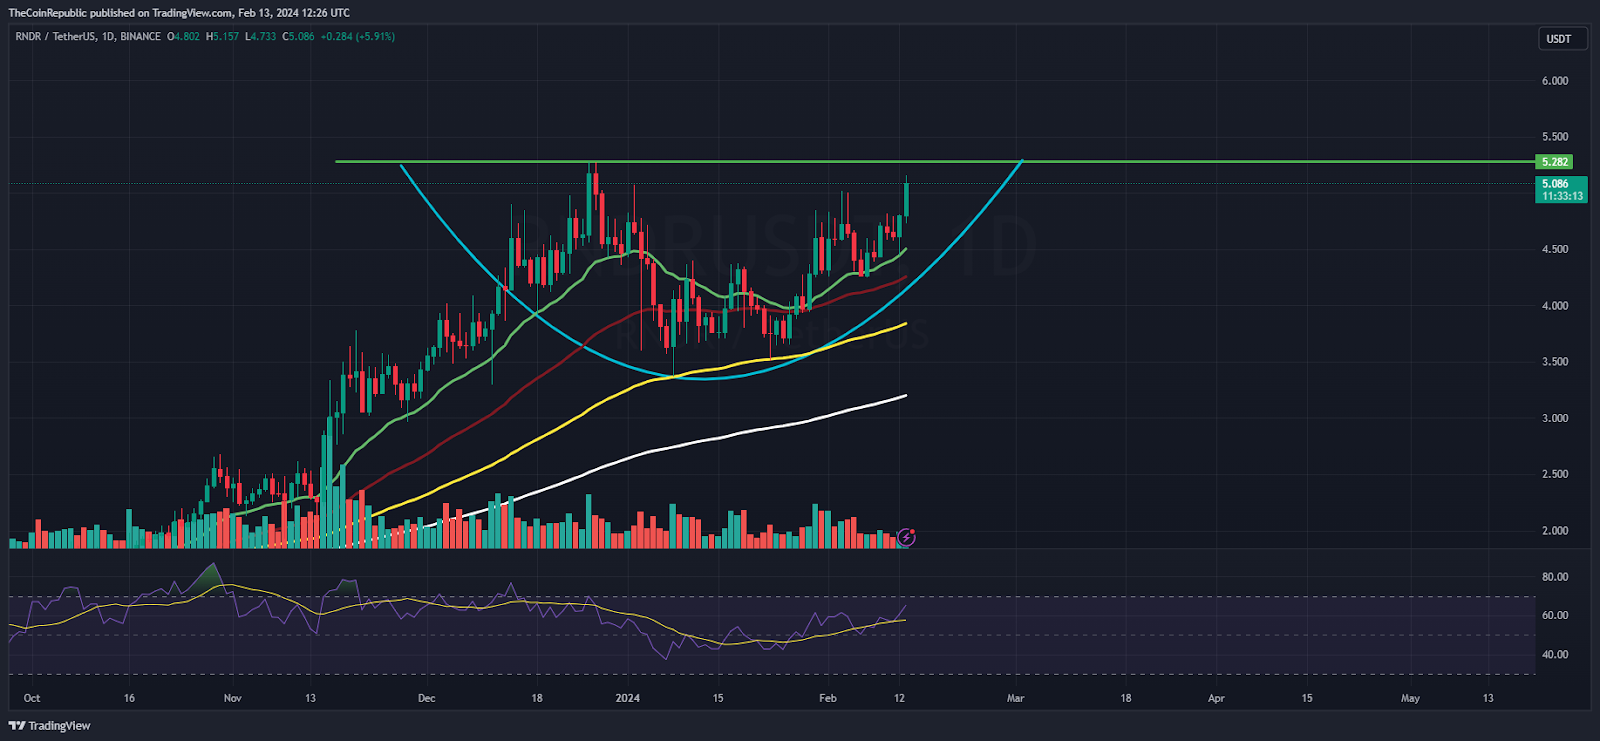
On the daily charts, the Render token price revealed a pullback from the 100-day EMA and retained strength above the $5 mark. However, the neckline of $5.20 is yet to be breached. If escaped, the token will boost the gains and reach $5.70 first and then $6. Furthermore, the price action delivers the bulls’ accumulation and is signaling an upside toward its 52-week high range of $7 soon.
The Relative Strength Index (RSI) curve stays in the overbought zone and shows a positive divergence, suggesting an upside for the short term. Moreover, the MACD indicator shows a bullish crossover and formed green bars on the histogram indicating outperformance for the upcoming sessions.
RNDR On Weekly Charts Exhibits Pullback From Demand Zone
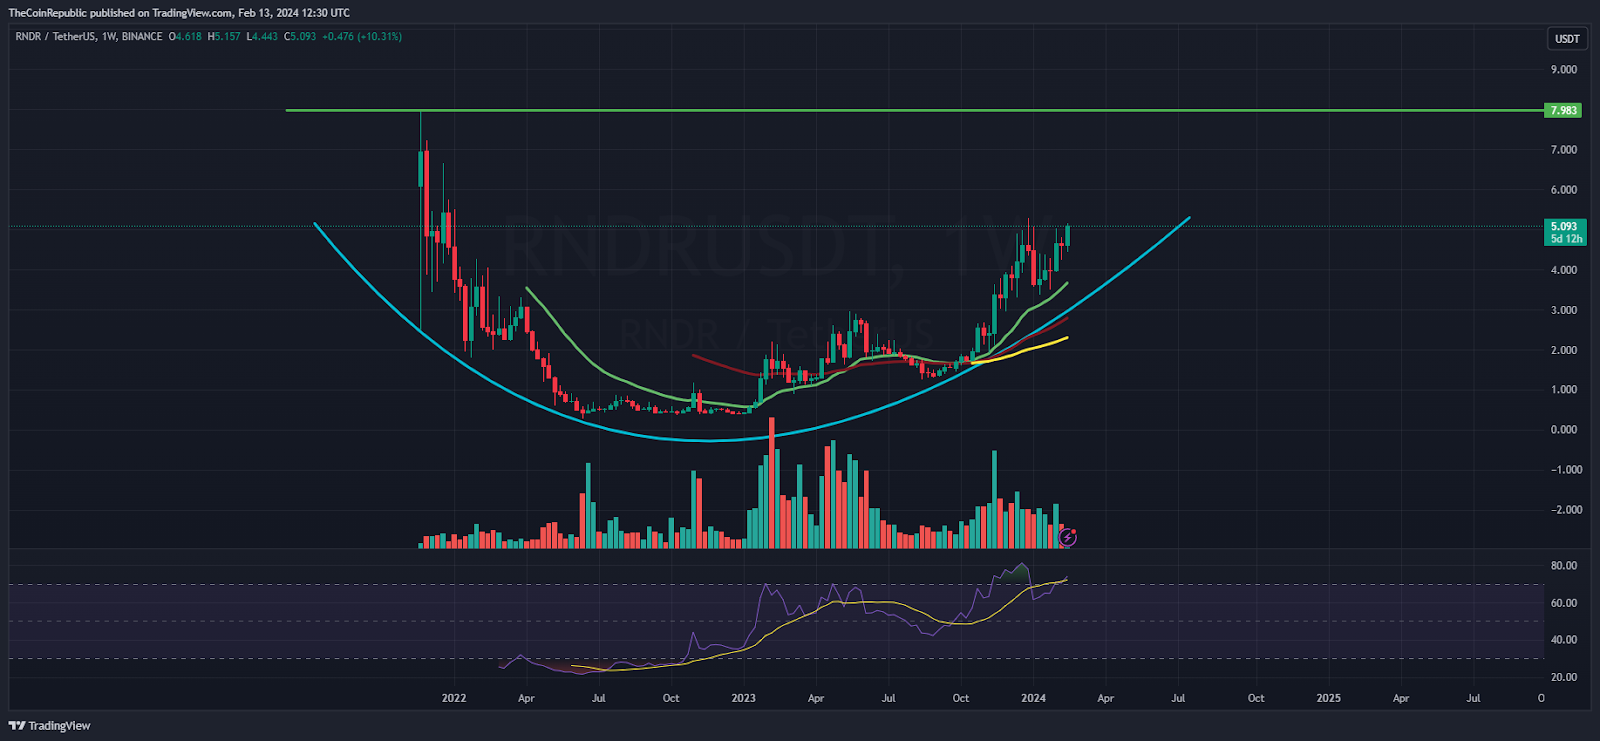
On the weekly charts, Render crypto price depicts a recovery from the lows of $1 and surged over 220% in the last three months, delivering a massive pump by the investors. Moreover, the token did not pause the rally and is eyeing to surpass the 52-week high range above $7 to be surpassed soon. Per the Fib levels, the token has escaped the 50% zone and is close to the 61.8% zone.
Summary
Render token (RNDR) price climbed above the round mark of $5 and noted a massive spike of over 12% intraday, delivering buying momentum. Moreover, the token is poised to extend the upside, and bulls are looking aggressive and will continue to dominate for the following sessions.
Technical Levels
Support Levels: $4.80 and $4.50
Resistance Levels:$5.20 and $5.50
Disclaimer
The views and opinions stated by the author or any other person named in this article are for informational purposes only and do not constitute financial, investment, or other advice. Investing in or trading crypto or stocks comes with a risk of financial loss.

With a background in journalism, Ritika Sharma has worked with many reputed media firms focusing on general news such as politics and crime. She joined The Coin Republic as a reporter for crypto, and found a great passion for cryptocurrency, Web3, NFTs and other digital assets. She spends a lot of time researching and delving deeper into these concepts around the clock, and is a strong advocate for women in STEM.


