
 Home
Home News
News
- 1 The RPL token witnessed a range-bound move and is depicting low investor interest.
- 2 Buyers still need to strike the upside of $35 and are trying to attain a breakout.
The Rocket Pool (RPL) token witnessed consolidation and faces low investor interest amid the positive market sentiments. However, the token has sustained gains and tried to strike the neckline of $35, but the breakout has not yet happened. Moreover, the token price was above the neutral region and is delivering a mixed stance despite the rejection from the highs of $65. From the top of $65, the token was corrected by over 55% in the last sessions.
The RPL token price has sustained gains above the key moving averages, and buyers are looking to cross the immediate hurdle of $35 to establish a breakout. However, the trend is neutral, and price action signifies the indecision candlestick, which recites the indecisiveness between the bulls and bears.

The Rocket Pool token (RPL) price was $031.61 at press time, with an intraday drop of 1.20%, reflecting consolidation on the charts. Moreover, the trading volume increased by 1.20% to $5.07 Million. The pair of RPL/BTC is at 0.000612 BTC, and the market cap is $597.89 Million. Analysts are neutral and suggest that the token may continue to hover in a narrow range and will face consolidation in the following sessions.
RPL On Daily Charts Displays Consolidation
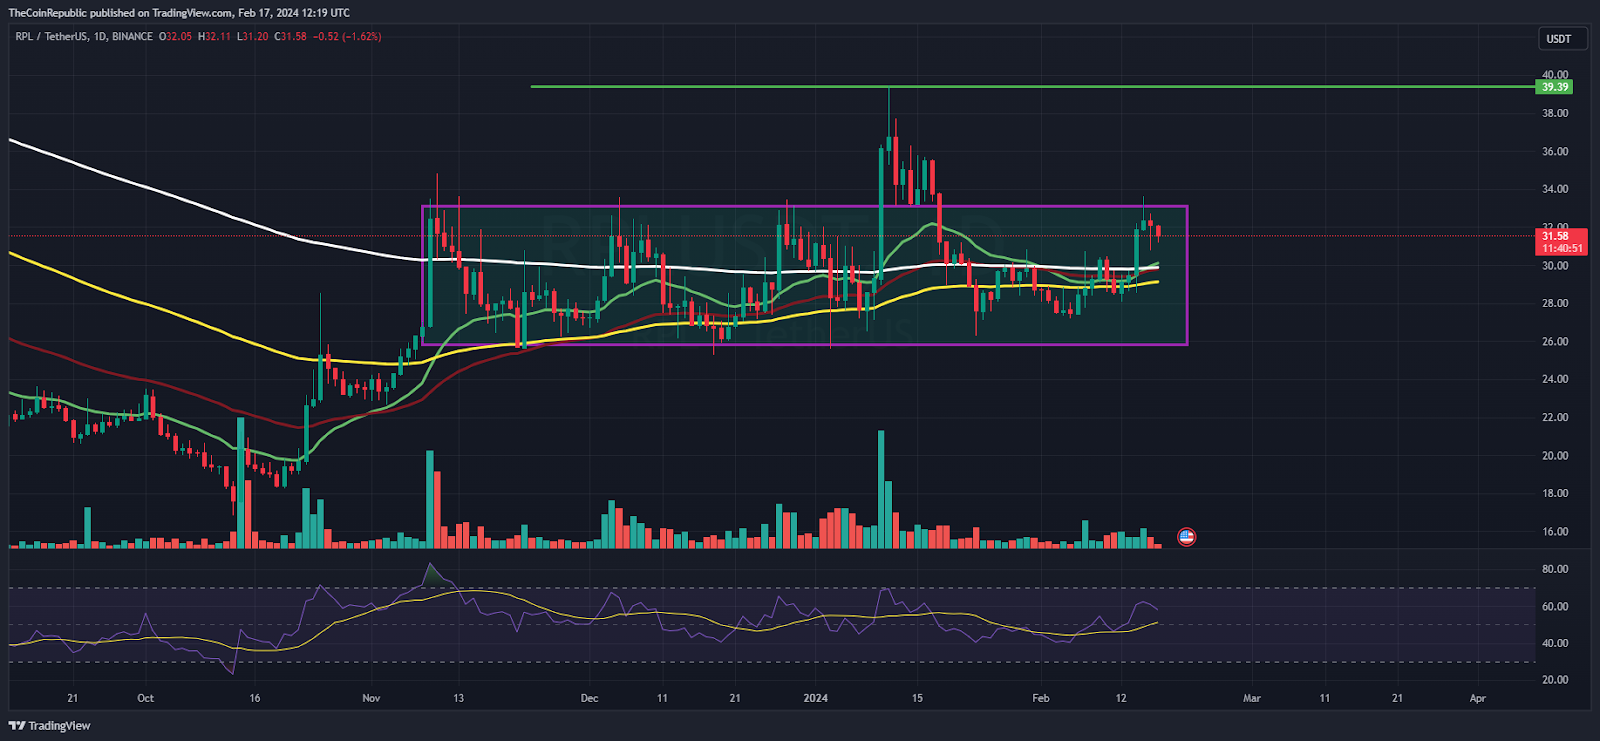
On the daily charts, Rocket Pool token price was hovering in a range for the past three months and displays consolidation. Despite the market’s bullishness, the RPL crypto price still did not succeed in attaining momentum and was stuck in a narrow range. Per the Fibonacci retracement levels, the token has sustained above the 23.6% zone and is trying to lift the token price above the 50% zone.
The Relative Strength Index (RSI) curve stayed in the overbought zone and showcased a positive divergence, which may glimpse a breakout soon. Moreover, the Moving Average Convergence Divergence (MACD) indicator displays a convergence of the MA line with the signal line reflecting uncertain moves.
RPL On Weekly Charts Reveals Rejection from the 50-Day EMA
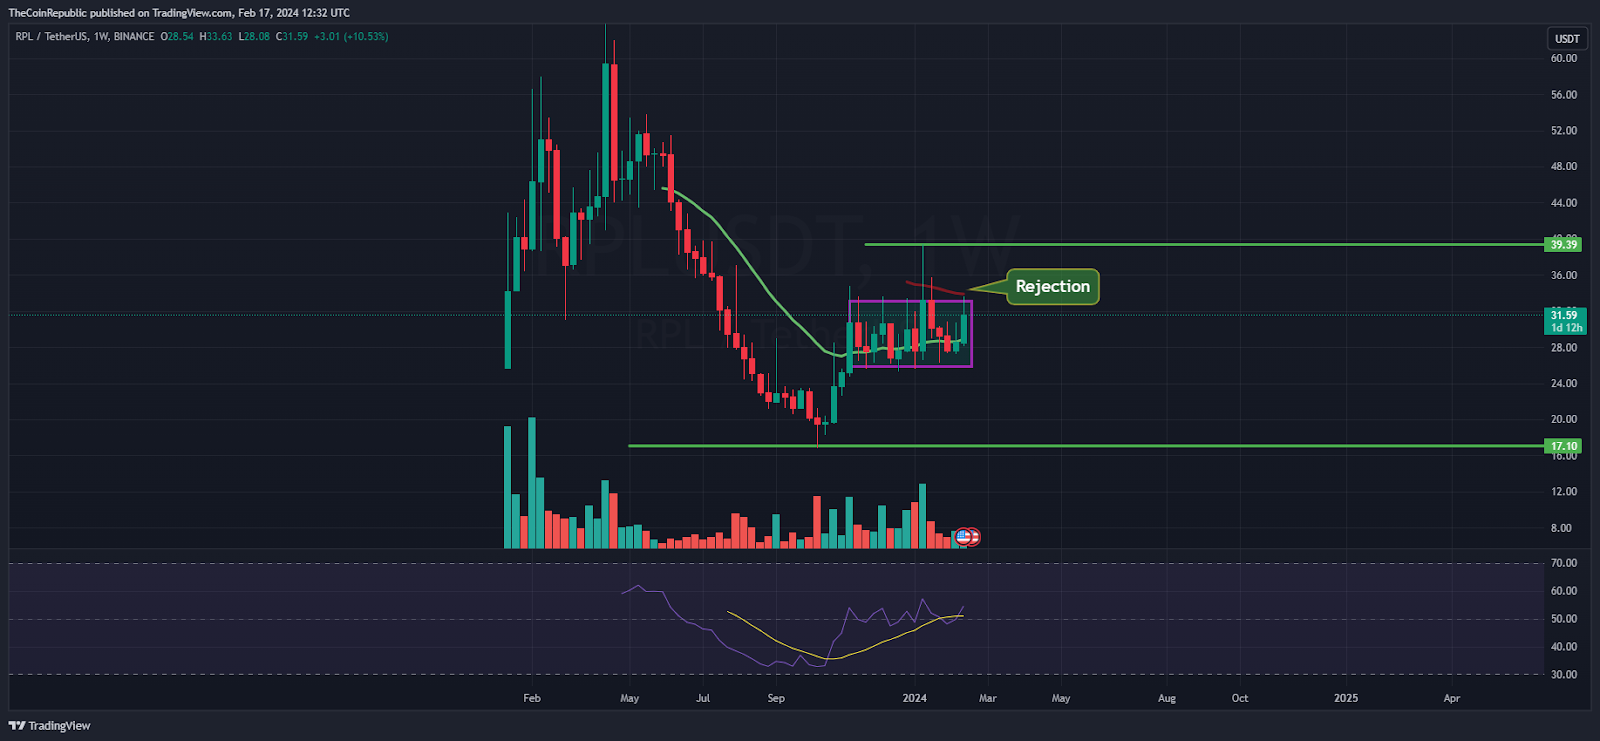
On the weekly charts, the token has failed to strike the resistance zone of $40 and has faced rejection from the 50-day EMA multiple times in the last weeks. Moreover, the token witnessed a sharp correction from the highs of $65, but somehow, bulls managed to hold the gains near $17 and recovered over 70% in the last sessions.
Summary
The Rocket Pool token (RPL) price stayed in a narrow range and persisted in delivering uncertain movements, reflecting a dilemma among investors. Moreover, the token could not surpass $35 and hovered in the bearish region, signifying low investor interest.
Technical Levels
Support Levels: $30 and $25
Resistance Levels:$35 and $40
Disclaimer
The views and opinions stated by the author or any other person named in this article are for informational purposes only and do not constitute financial, investment, or other advice. Investing in or trading crypto or stocks comes with a risk of financial loss.

Andrew is a blockchain developer who developed his interest in cryptocurrencies while pursuing his post-graduation major in blockchain development. He is a keen observer of details and shares his passion for writing, along with coding. His backend knowledge about blockchain helps him give a unique perspective to his writing skills, and a reliable craft at explaining the concepts such as blockchain programming, languages and token minting. He also frequently shares technical details and performance indicators of ICOs and IDOs.


