
 Home
Home News
News
- 1 GMT price showed a double bottom formation and reverted the gains.
- 2 Buyers are looking to cross the immediate hurdle of $0.3000.
GMT price signifies a pullback from the critical support zone of $0.2300 and witnessed buyer accumulation in the last sessions. The token has retained gains and is depicting bullish momentum and bulls are looking to crack the upside of $0.3000, to extend the up move. However, the price action shows a reversal, but needs to cross the make or break zone of $0.3000, to clear that the pullback is trustworthy or fake.
GMT token price has climbed above the key moving averages and is delivering follow on buying momentum in the past sessions. Moreover, the price action demonstrates the bulls intention to cross the trajectory high of $0.3000 to incline the reversal toward the bullish region of $0.3800. Per the Fib levels, the token has sustained gains above the 23.6% level and is still below the 38.2% zone which exists near $0.3400.
The GMT crypto (GMT) price was $0.2774 at press time, with an intraday gain of 2.16%, reflecting buyer accumulation on the charts. Moreover, the trading volume increased by 9.38% to $1.54 Million. The pair of GMT/BTC is at 0.00000697 BTC, and the market cap is $154.22 Million. Analysts are neutral and suggest that the price will escape the upside of $0.3000 which might retain bullishness in the following sessions.
GMT On Daily Charts Displays Pullback From Support Zone
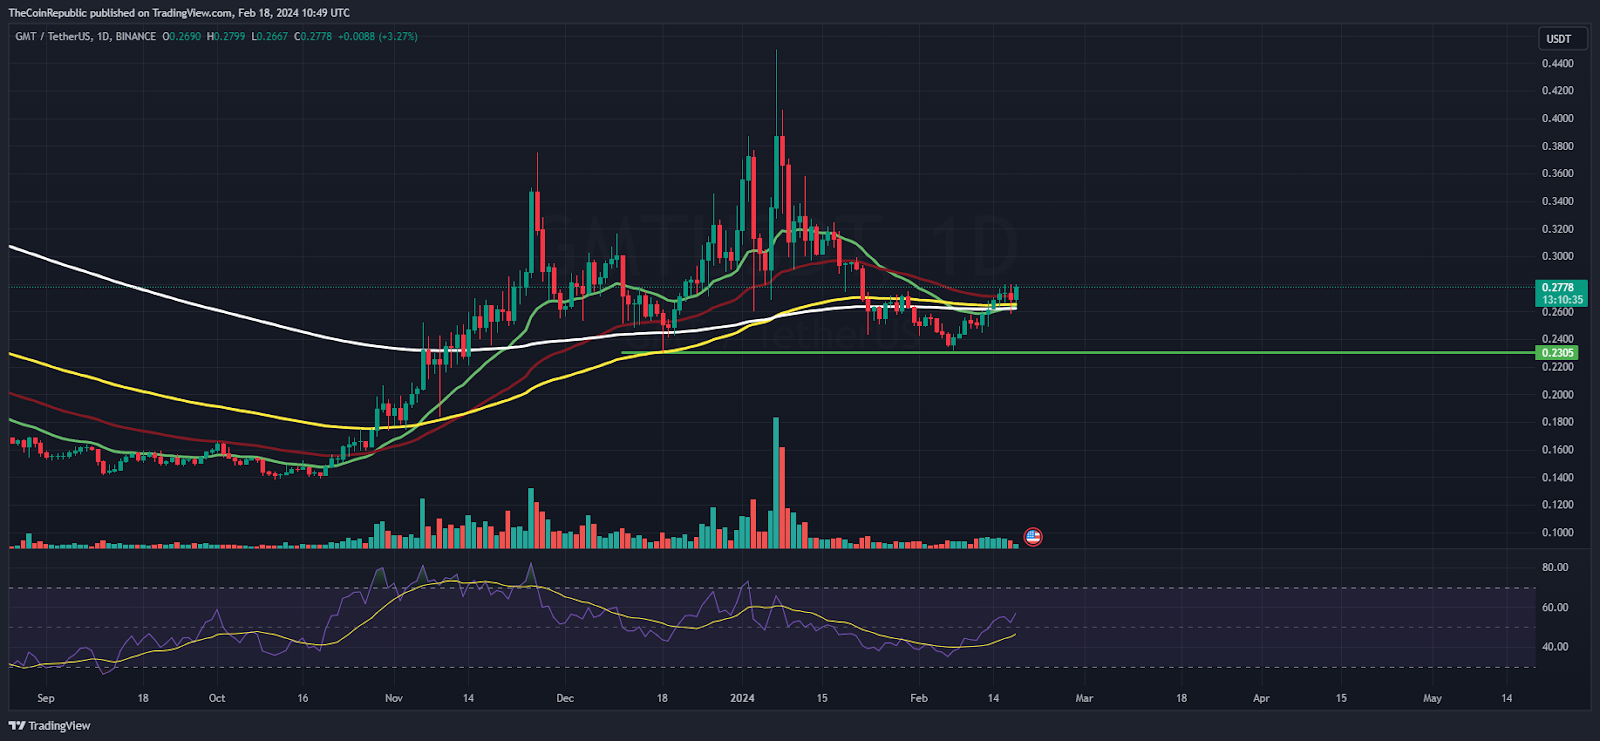
On the daily charts, the token has shown a pullback from the support zone of $0.2300 and reflects buyer accumulation in the last sessions. Moreover, the price action signifies the higher high swings and investors are carrying their attention and are keen to lift the token above $0.3000 to glimpse further delights.
The Relative Strength Index (RSI) curve stays in the overbought zone and forming a positive crossover signifies the buying momentum. Moreover, the MACD indicator shows a bullish crossover replicating the reversal on the charts.
GMT On Weekly Charts Exhibits Trend Reversal
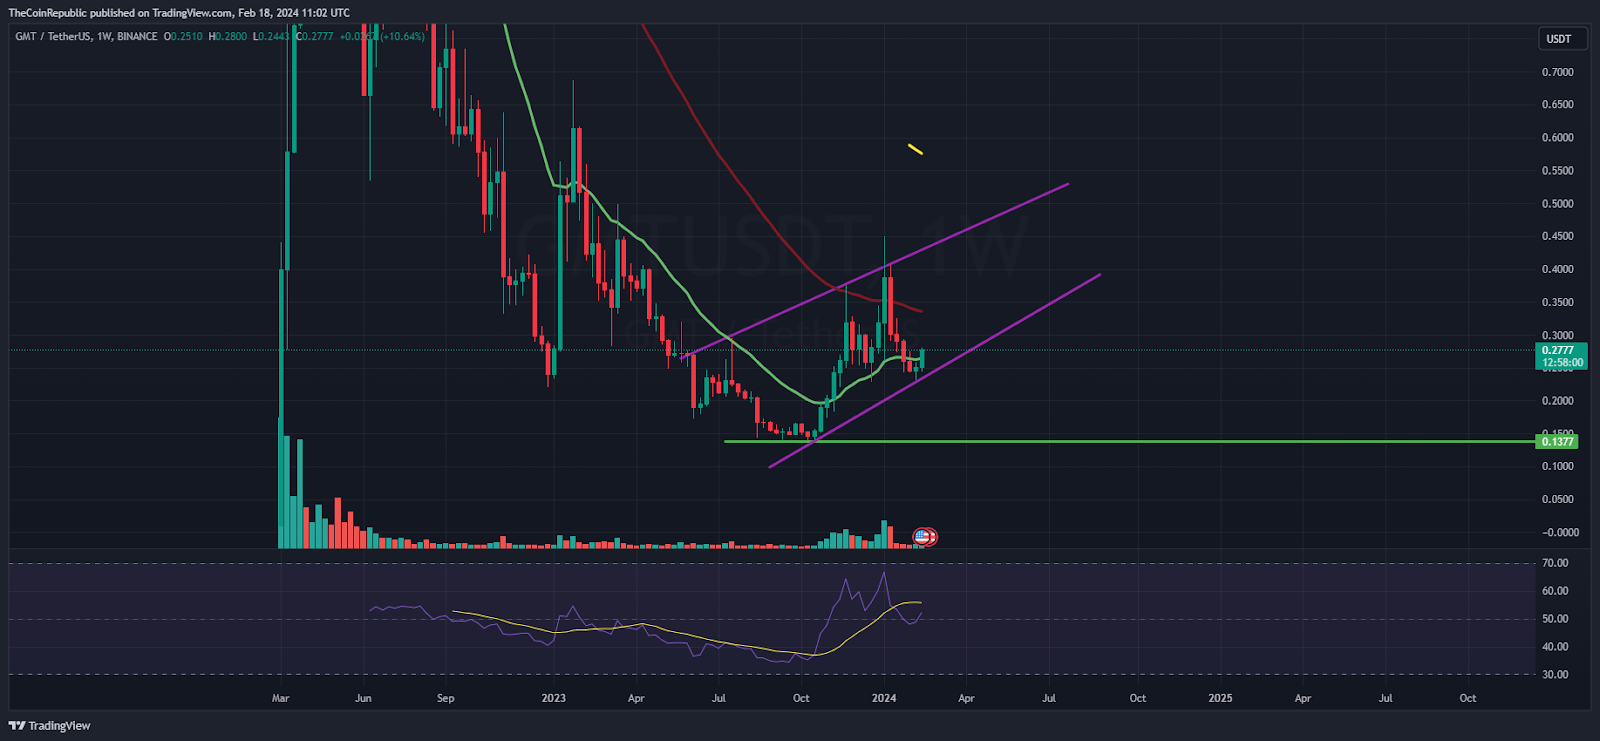
On the weekly charts, the token has articulated a reversal and created a rising parallel channel which leads the reversal above the 20-Day EMA mark. However, the bulls found it difficult to cross the 50-Day EMA mark and displayed a rejection candlestick near the channel highs.
Summary
GMT price has crossed the key hurdle of $0.2700 and is heading toward the make or break region of $0.3000, which if crossed, fresh bull rally can be anticipated toward $0.3500. Additionally, the trend is neutral and bulls need to hold the dominance by sustaining the token above the 20-Day EMA mark to stretch the pullback toward the blue sky zone of $0.4000.
Technical Levels
Support Levels: $0.2500 and $0.2300
Resistance Levels:$0.3000 and $0.3200
Disclaimer
The views and opinions stated by the author or any other person named in this article are for informational purposes only and do not constitute financial, investment, or other advice. Investing in or trading crypto or stocks comes with a risk of financial loss.

Andrew is a blockchain developer who developed his interest in cryptocurrencies while pursuing his post-graduation major in blockchain development. He is a keen observer of details and shares his passion for writing, along with coding. His backend knowledge about blockchain helps him give a unique perspective to his writing skills, and a reliable craft at explaining the concepts such as blockchain programming, languages and token minting. He also frequently shares technical details and performance indicators of ICOs and IDOs.


