
 Home
Home News
News

- 1 The ARB token price is waiting for a bounce above the round mark of $2.
- 2 The token anticipates a breakout and hovers close to the 20-day EMA mark.
Arbitrum (ARB) token price action displays rejection from the highs of $2.40 and retracement below the critical support mark of $2.00. The token is trying to take support on the 20-Day EMA mark and forming a symmetrical triangle pattern, which may lead to a bounce.

The ARB token price showed a higher low formation, confirming the bears’ desire to book profits at the highs. If the token succeeds in securing the 20-Day EMA mark, it may lead to a breakout, which rolls the token toward $2.10. Conversely, if it slips below $1.80, it may boost the selloff that redirects the token to $1.50 shortly. Amid the market surge, the token failed to sustain gains above $2, and a throwback resulted in a decline of over 20% this month.

The Arbitrum token (ARB) price was $1.91 at press time, with an intraday drop of 5.58%, showing neutrality on the charts. Moreover, the trading volume increased by 71.89% to $566.47 Million. The pair of ARB/BTC is at 0.0000362 BTC, and the market cap is $2.35 Billion. Analysts are bullish and suggest that the Arbitrum (ARB) token price will face volatility. It may gain momentum above $2 soon.
ARB Displays Symmetrical Triangle Formation on the Daily Timeframe
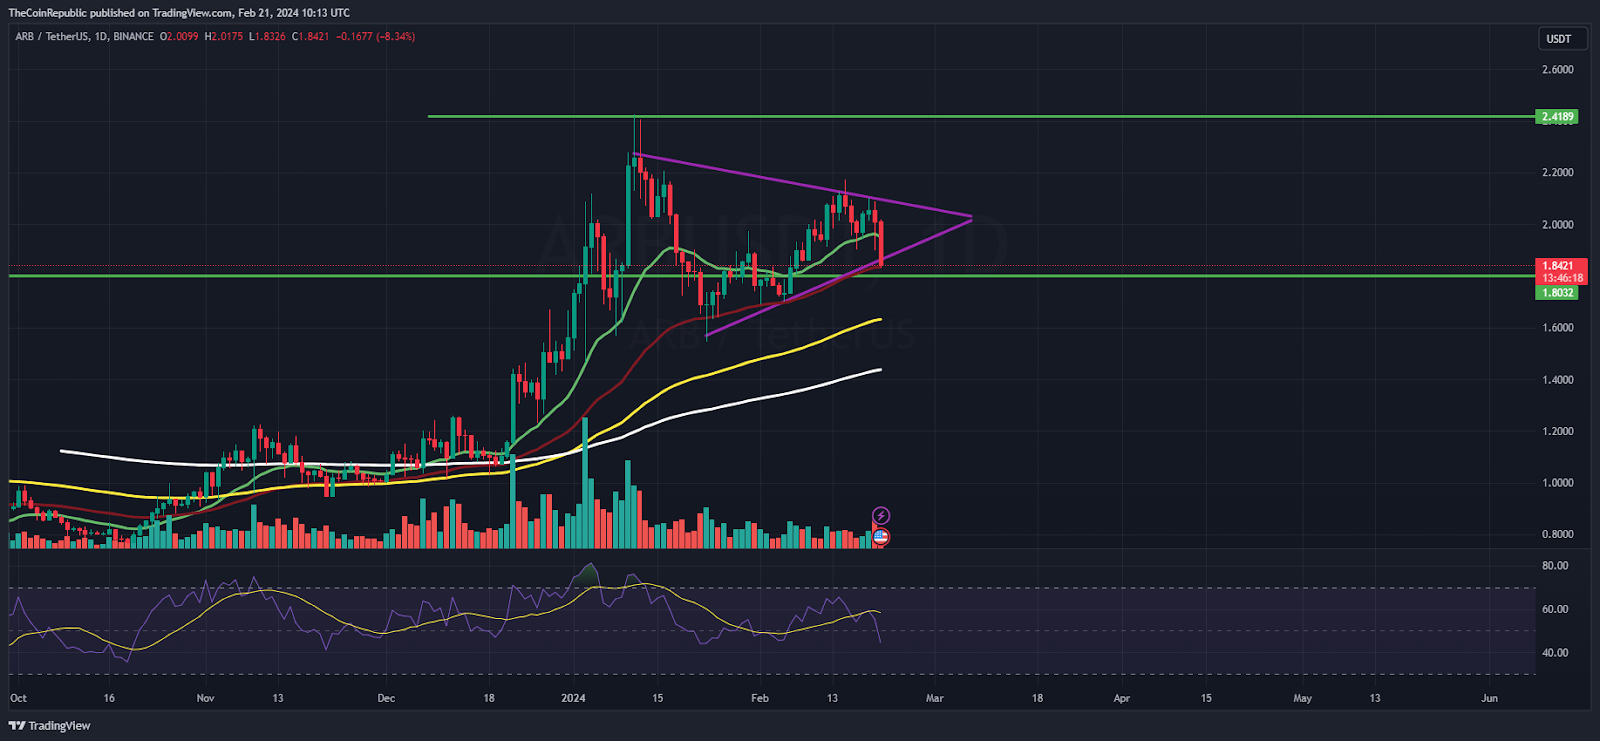
The ARB token was in an uptrend on the daily charts and witnessed a massive recovery from the lows. The token recently jumped above $2, which gives bulls an edge. The trend could not last longer, and profit booking led to a drawdown from the highs. However, the trend is intact, and indecisiveness was noted between the bulls and the bears. Bulls must hold the token above the 20-Day EMA for a healthy recovery.
The RSI curve slipped from the overbought zone and is near 45, noting a negative crossover. Similarly, the MACD indicator shows a bearish crossover and selling pressure, which suggests the token might reveal a breakdown soon.
ARB Exhibits an Uptrend on Weekly Charts
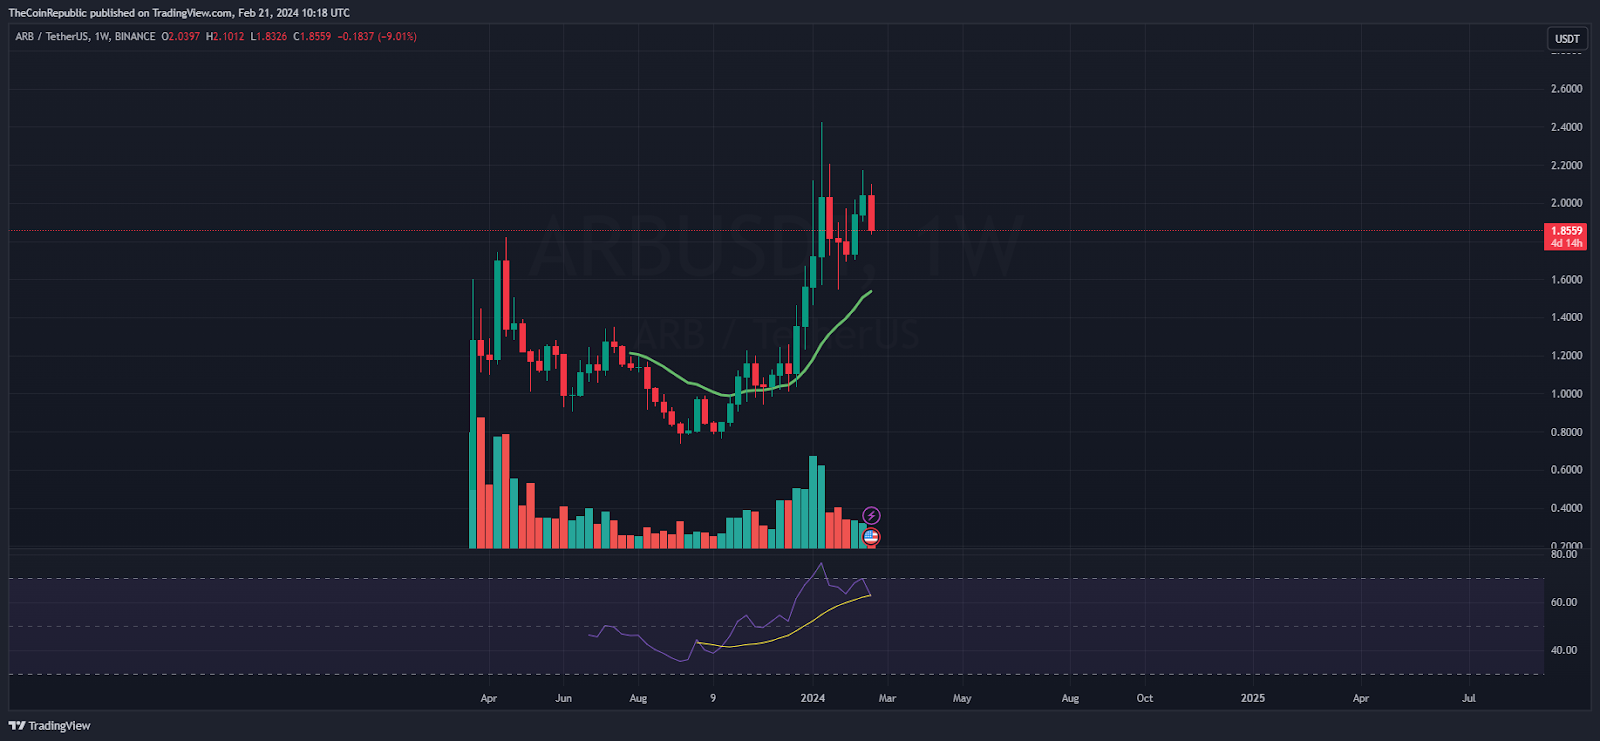
Despite the ups and downs in the market, the Arbitrum token persisted in delivering bullishness in the past and rolled back from the lows to the highs. However, after a massive comeback, some profit booking may be seen, which is not unusual, but investors need to keep an eye on the $1.50 mark until the mark is not breached. The trend is positive, but it will lead to a correction in the short term if breached.
Summary
The Arbitrum token price displayed a bearish engulfing candlestick and noted a profit booking phase from the highs, triggering panic among investors. The 20-Day EMA mark is a make-or-break zone that bulls are trying to secure to avoid any correction. The RSI and MACD are giving bearish signals.
Technical Levels
Support Levels: $1.70 and $1.50
Resistance Levels:$2.10 and $2.30
Disclaimer
The views and opinions stated by the author or any other person named in this article are for informational purposes only and do not constitute financial, investment, or other advice.

Amanda Shinoy is one of the few women in the space invested knee-deep in crypto. An advocate for increasing the presence of women in crypto, she is known for her accurate technical analysis and price prediction of cryptocurrencies. Readers are often waiting for her opinion about the next rally. She is a finance expert with an MBA in finance. Quitting a corporate job at a leading financial institution, she now engages herself full-time into financial education for the general public.


