
 Home
Home News
News
- 1 Polkadot crypto price is currently trading at $7.383 with a drop of 4.58% in the last 24 hours with a market cap of $7.383 Million.
- 2 Polkadot crypto price has increased by 9.68% over the past month.
Polkadot price halted near the $10 mark and is heading in the downward direction. However, the price is still above the key moving averages.
Over the week, Polkadot crypto price decreased approximately 0.19% while over the month, there was a 9.68% increase. Looking back over the past three months, DOT price increased by about 41.40%, while the increase extends to around 66.09% over the last six months. The crypto’s performance throughout the year has been volatile, with a year-to-date slump of approximately 11.01%.
At press time, the Polkadot crypto price was $7.346, with an intraday loss of 5.05%, showing bearishness on the charts. Moreover, the trading volume is 357.08 Million. The market cap is $9.42 Billion. Indicators are giving buying signals.
Technical Analysis of Polkadot Crypto Price in 1-D Timeframe
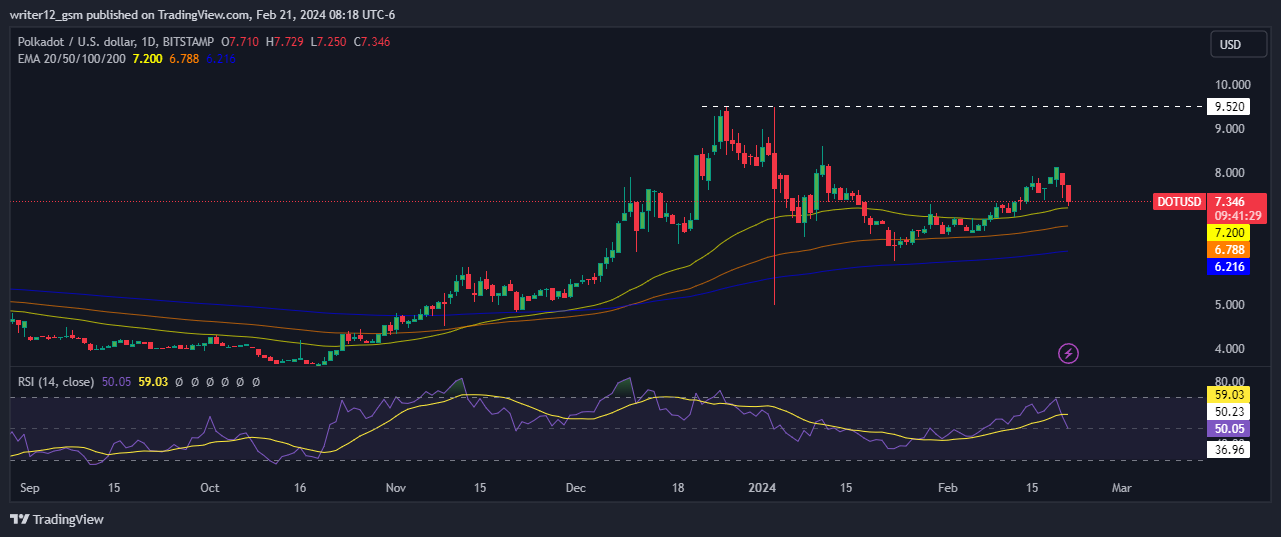
Polkadot (USD: DOT) has seen its crypto price rise steadily for the past three months, rising 41%. At the time of writing, DOT crypto is trading in a bearish zone. At the time of publishing, Polkadot crypto (USD: DOT) is trading below the 20-Day EMA (exponential moving average), signaling weakness.
The current value of RSI is 48.44 points. The 14 SMA is above the median line at 58.91 points which indicates that the Polkadot crypto is bearish. The MACD line at 0.189 and the signal line at 9.35 are above the zero line. MACD curve and the signal curve are mildly turned downward hinting about bearishness.
If it can keep this level, the Polkadot price could continue to go up and reach the first and second targets of $8.00 and $10.00. However, if the DOT price cannot maintain this level and falls, then it might hit the closest support levels of $7.196 and $6.215.
However, if the selling volume accumulates, the price might break the supporting SMAs by forming lower highs and lows. Consequently, the DOT price is expected to move downwards, indicating a bearish outlook on the daily timeframe chart.
Conclusion
Polkadot crypto has been showing a strong performance in the past few months, as it has risen by 41% in three months and 66% in six months. However, the price has also faced some bearish pressure and volatility, as it has failed to sustain above the $10 level and the 20-Day EMA. The price needs to maintain the support of the $7.196 level and the MACD indicator to continue the uptrend.
Technical Levels
Support Levels: $7.196 and $6.215
Resistance Levels: $8.00 and $10.00
Disclaimer
This article is for informational purposes only and does not provide any financial, investment, or other advice. The author or any people mentioned in this article are not responsible for any financial loss that may occur from investing in or trading. Please do your own research before making any financial decisions.

Andrew is a blockchain developer who developed his interest in cryptocurrencies while pursuing his post-graduation major in blockchain development. He is a keen observer of details and shares his passion for writing, along with coding. His backend knowledge about blockchain helps him give a unique perspective to his writing skills, and a reliable craft at explaining the concepts such as blockchain programming, languages and token minting. He also frequently shares technical details and performance indicators of ICOs and IDOs.


