
 Home
Home News
News
- 1 The ZEC coin price signifies rejection from the 200-day EMA mark.
- 2 Bears are dominating and are willing to push the token toward the $20 level.
The Zcash (ZEC) token price was in a downtrend and has replicated a rejection amidst the rebound. However, the coin continued to form the lower lows and suggested a further decline toward the $20 level on a short-term basis. The trend is negative and sellers may continue to put pressure on the bulls, leading to a selloff.
The ZEC coin price is trading close to the 50-day EMA and rejected from the 200-day EMA mark, signifying a volatile movement. Additionally, the coin witnessed a major downtrend and offered no significant bounce. The coin was in a correction phase and eroded over 40% in the previous three months. ZEC coin has given a negative return of (-54%), which signifies a downtrend throughout the year.
The Zcash coin (ZEC) price was $0.9862 at press time, with an intraday drop of 6.38%, showing bearishness on the charts. Moreover, the trading volume increased by 44.89% to $89.02 Million. The pair of ZEC/BTC is at 0.000466 BTC, and the market cap is $386.98 Million. Analysts are bearish and suggest that the Zcash (ZEC) coin price will continue to face selling pressure and may break the make-or-break zone of $20 soon.
ZEC Displays Bears Dominance On Daily Charts
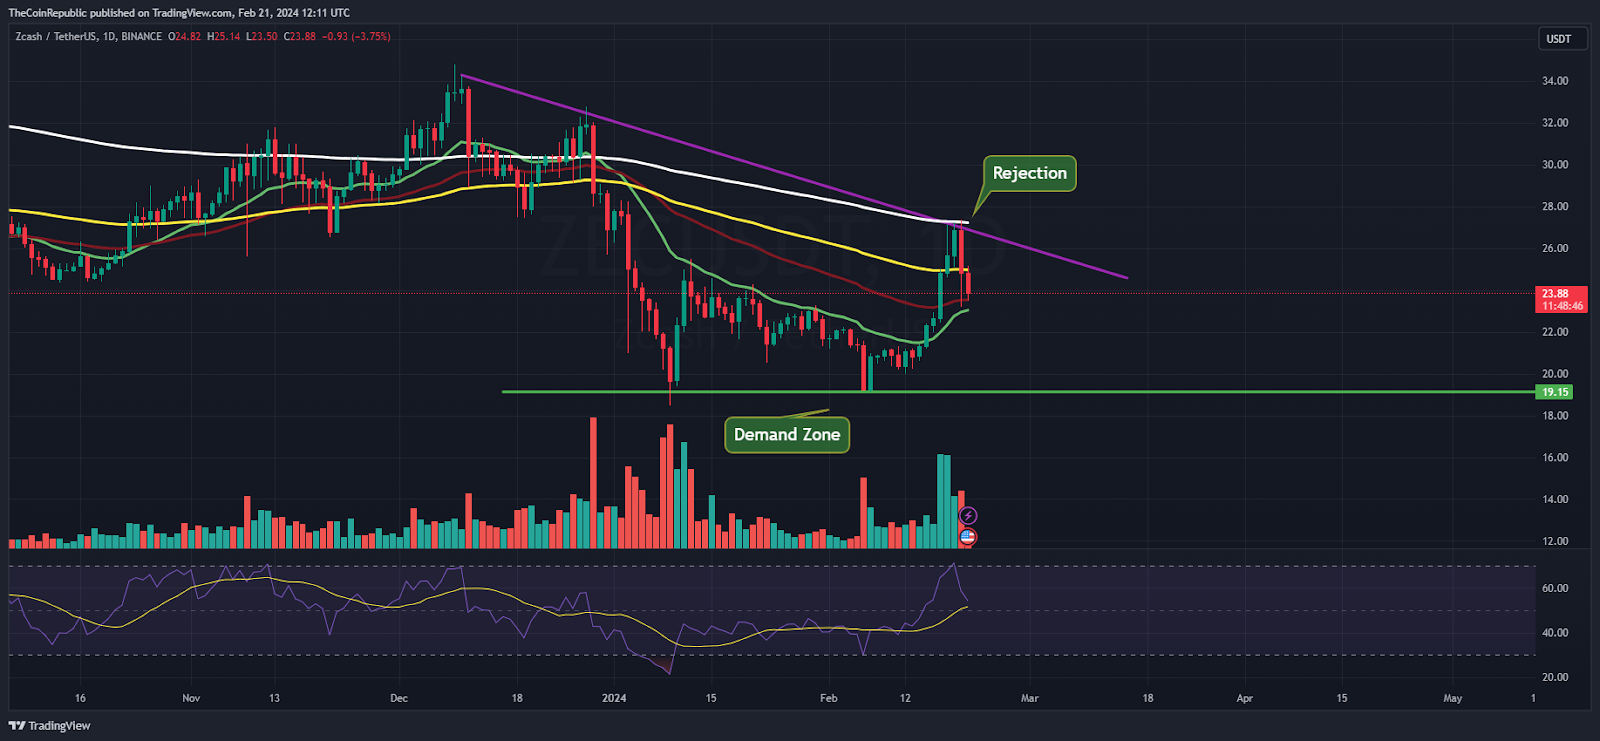
On the daily charts, the coin persisted in forming the lower lows and delivered rejection from the trendline for the past weeks. Additionally, the coin did not succeed in scratching the 200-day EMA mark while attempting a rebound, and the bulls failed. The price action suggests that the coin may retest the demand zone of $20 soon. Moreover, the trend is bearish, and sellers are looking aggressive, which has persisted in adding short positions. The Bears are willing to push the coin below $20 to initiate a major breakdown. Per the Fib levels, the coin has slipped below the 23.6% zone, hints of negativity, and will result in further decline soon.
The Relative Strength Index (RSI) curve slipped from the overbought zone, dragged to the neutral zone, signifying rejection, and formed a negative divergence. Similarly, the MACD indicator shows a bearish crossover and formed red bars on the histogram, replicating the selling pressure.
ZEC Displays Follow-on Selling Momentum On Weekly Charts
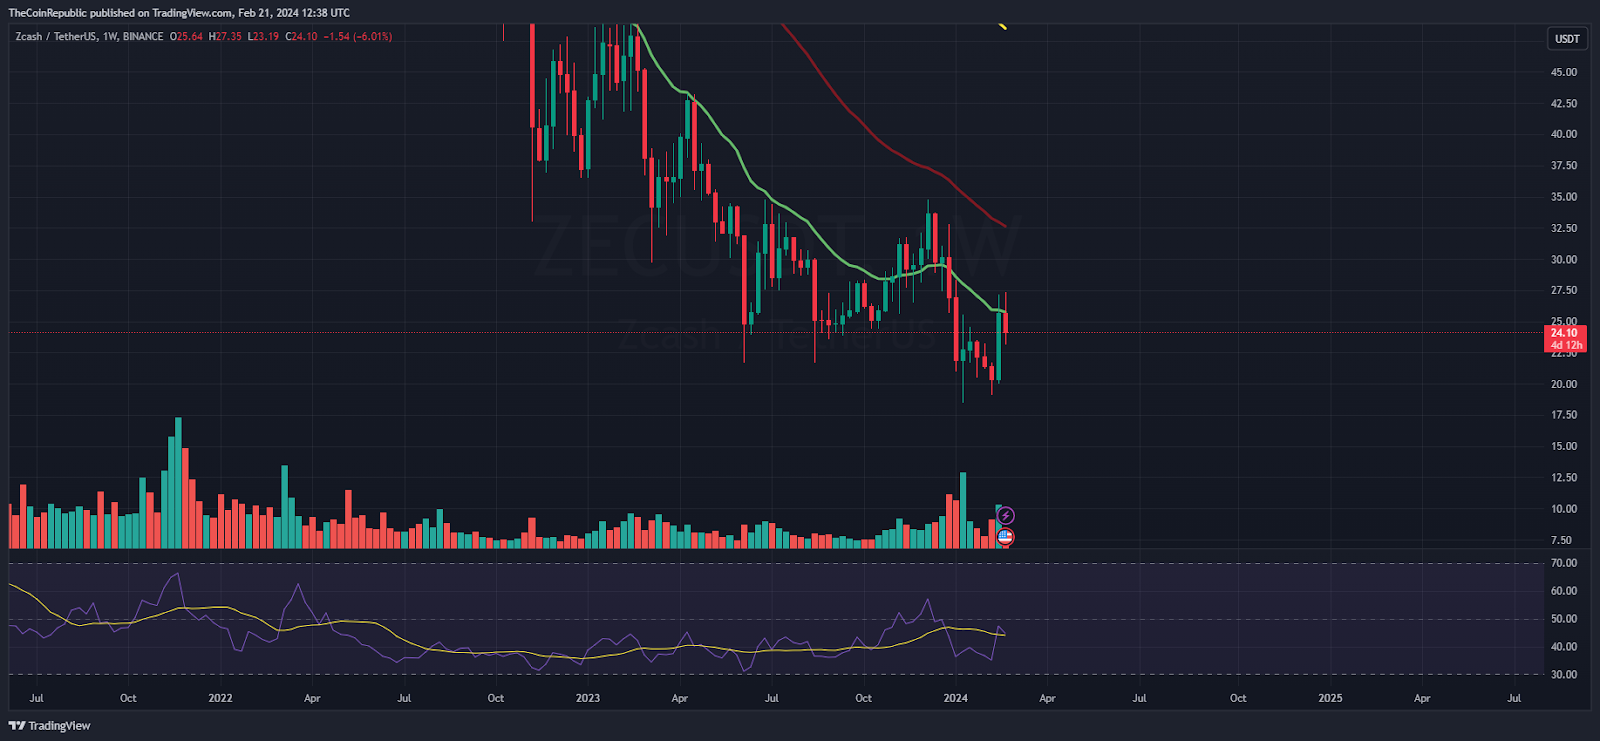
On the weekly charts, the coin persisted in dragging gains from the highs and articulated lower lows, signifying the sellers’ dominance. Moreover, the coin was in a severe downtrend and may retest the demand zone of $20 shortly. Amid the market recovery, the coin attempted a rebound. However, the bulls failed and a rejection occurred due to the bears’ dominance.
Summary
The Zcash (ZEC) coin signifies a downtrend and persists in eroding gains amidst the bounce in the crypto market. Moreover, the coin did not succeed in holding gains above the 20-day EMA, which is a negative sign.
Technical Levels
Support Levels: $20 and $18
Resistance Levels:$25 and $27
Disclaimer
The views and opinions stated by the author or any other person named in this article are for informational purposes only and do not constitute financial, investment, or other advice.

Nancy J. Allen is a crypto enthusiast, with a major in macroeconomics and minor in business statistics. She believes that cryptocurrencies inspire people to be their own banks, and step aside from traditional monetary exchange systems. She is also intrigued by blockchain technology and its functioning. She frequently researches, and posts content on the top altcoins, their theoretical working principles and technical price predictions.


