
 Home
Home News
News
- 1 Dogecoin observed a range-bound movement amidst the bullish outlook.
- 2 Buyers are attempting for a breakout, but failed to register.
The Dogecoin price noticed a notable correction from the swing spot of $0.1050, signifying sideways activities. Afterward, the meme coin could not bounce beyond the primary hurdle of $0.0900, the range upper neckline. Amidst the bullish market sentiments, DOGE price dwelled in a narrow range, conveying low investor interest. The memecoin price failed to register a noteworthy bounce amid multiple attempts and endured in a range.
DOGE price prevailed above the key moving averages and glimpsed neutrality on the charts. However, the volatility rate of Dogecoin was pulled from 63 to 29%, indicating a downtrend, and investors are not showing their interest, resulting in a consolidation for the past weeks. Per the Fibonacci retracement zone, the meme-coin price stayed above the 23.6% zone, delivering a negative outlook.
The Dogecoin (DOGE) price was $0.08485 at press time, with an intraday gain of 0.71%, showing neutrality on the charts. Moreover, the trading volume has increased by 22.78% to $445.70 Million. The pair of DOGE/BTC is at 0.00000166 BTC, and the market cap is $11.96 Billion. Analysts are neutral and suggest that the Dogecoin (DOGE) price will continue to face selling pressure and may retest $0.06000 soon.
Dogecoin Reveals a Double Top Formation: Can It Trigger Another Selloff?
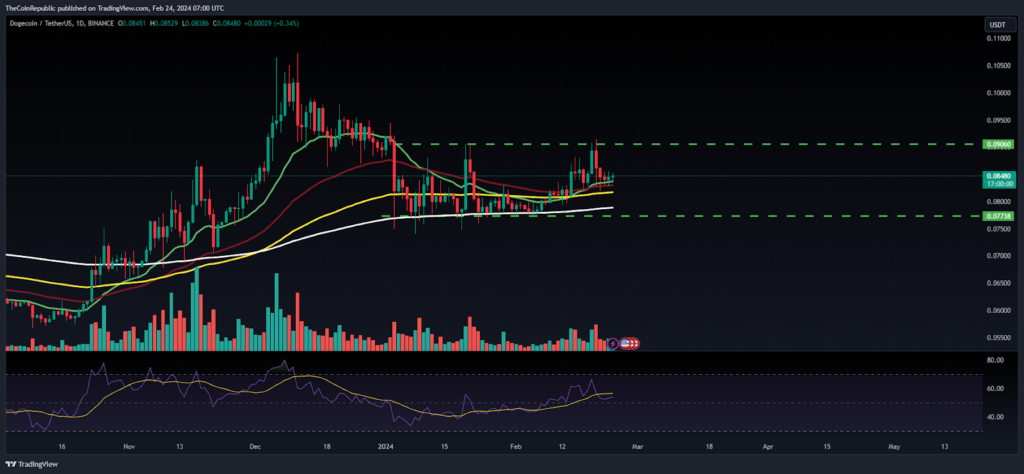
Dogecoin featured a double top pattern and glanced a rejection from the upper neckline of $0.09000, which was retested multiple times. Still, bulls could not surpass, signifying the sellers’ dominance. However, the DOGE price sustained gains above the 20-day EMA support zone, which tied the coin from any harsh selloff for the past sessions. If the DOGE price breaks the range low of $0.07500, it may activate another selloff and proceed to the lows of $0.06000 soon.
The Relative Strength Index (RSI) stays near 55, symbolizing a negative divergence and suggesting bearish sentiments for the upcoming sessions. However, the MACD indicator shows a convergence of the MA line with the signal line representing the uncertainty on the charts.
DOGE Exhibits Long-Legged Bearish Doji: Are Bulls Trapped?
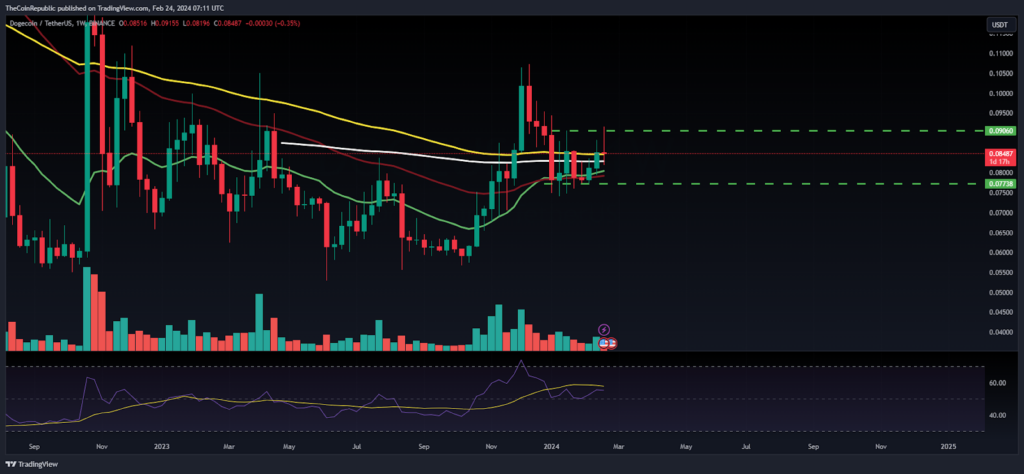
This week, Dogecoin noticed a bounce from the 50-day EMA mark and retested the range upper neckline of $0.0900, but an exceptional price move happened. Afterward, the meme coin spoiled the gains and displayed a rejection, denoting a long-legged doji candlestick conveying the sellers’ grip there. Any slippage below $0.08000 could trigger drastic fall, and buyers have persisted in preventing the breakdown for the past sessions, resulting in consolidation.
Summary
The Dogecoin (DOGE) price failed to break the upper neckline of $0.0900 and glimpsed selling pressure in the last sessions. However, the selloff has not yet begun, but a negative outlook was glimpsed, which signifies fear among investors.
Technical Levels
Support Levels: $0.08000 and $0.07800
Resistance Levels:$0.09000 and $0.09800
Disclaimer
The views and opinions stated by the author or any other person named in this article are for informational purposes only and do not constitute financial, investment, or other advice.

Adarsh Singh is a true connoisseur of Defi and Blockchain technologies, who left his job at a “Big 4” multinational finance firm to pursue crypto and NFT trading full-time. He has a strong background in finance, with MBA from a prestigious B-school. He delves deep into these innovative fields, unraveling their intricacies. Uncovering hidden gems, be it coins, tokens or NFTs, is his expertise. NFTs drive deep interest for him, and his creative analysis of NFTs opens up engaging narratives. He strives to bring decentralized digital assets accessible to the masses.


