
 Home
Home News
News

- 1 The ZEC coin price displayed a rebound and is leading gains toward $35.
- 2 Buyers have gained momentum and is glancing bullishness.
Zcash coin (ZEC) coin enlisted a pullback from the bottom mark of $20 and is riding a rebound in the last sessions. The coin has split the key hurdle of $25 and is stretching the pullback toward $30. Buyers have gained momentum and intend to carry forward the gains. However, the bulls must sustain above the 200-day EMA to extend the rebound.

The Zcash (ZEC) coin has surpassed the significant moving averages and delivers follow-on buying momentum. The coin has surged over 20% this week, and bullishness was reflected. Moreover, the coin has exited out of the correction phase and is ready to outperform for the upcoming sessions. However, the round mark of $30 is yet not breached, and investors are eyeing the level to escape for making fresh positions. Per the Fib levels, the coin has jumped above the 23.6% zone and is heading toward the 38.2% zone.

The Zcash coin (ZEC) price was $27.68 at press time, with an intraday gain of 0.87%, showing neutrality on the charts. Moreover, the trading volume has increased by 18.78% to $89.09 Million. The pair of ZEC/BTC is at 0.000544 BTC, and the market cap is $453.50 Million. ZEC coin has a weekly return ratio of 22.52% and 26.48% on a monthly basis. Analysts are bullish and suggest that the Zcash crypto (ZEC) price will continue to extend the reversal and may retain the highs of $40 shortly.
Zcash Displays Double Bottom Formation: Is the Bullish Trend Ahead?
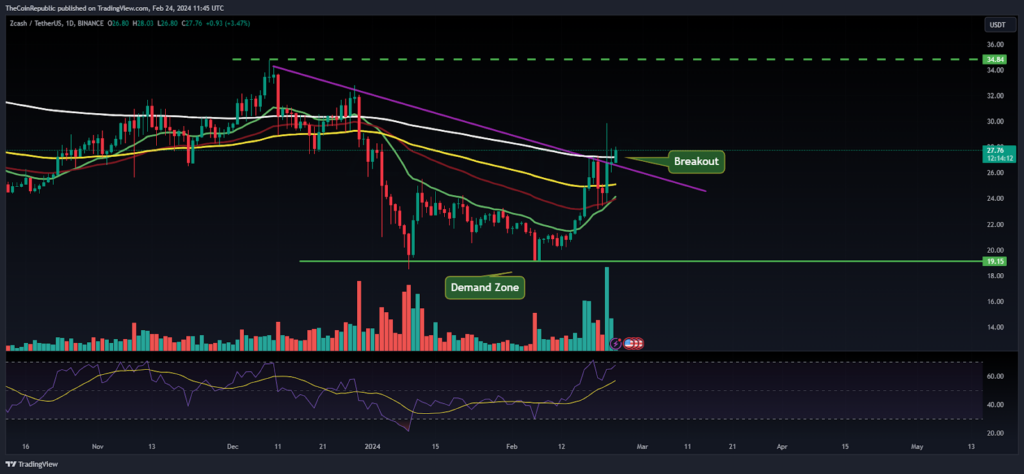
Zcash (ZEC) coin has formed a double bottom formation near the support zone of $20 and decisively crossed the 200-day EMA hurdle. Moreover, the coin has split the downward trendline and is ready to outperform in the following sessions. Bulls must surpass $30 to stretch the upward move toward $35, followed by $40.
The Relative Strength Index (RSI) curve stayed in the overbought zone and formed a positive divergence, suggesting the bounce may continue in the following sessions. Similarly, the MACD indicator shows a bullish crossover and displays signs of buyer accumulation, indicating a positive outlook.
ZEC Exhibits Falling Channel, Can ZEC Escape 50 Day EMA Hurdle?
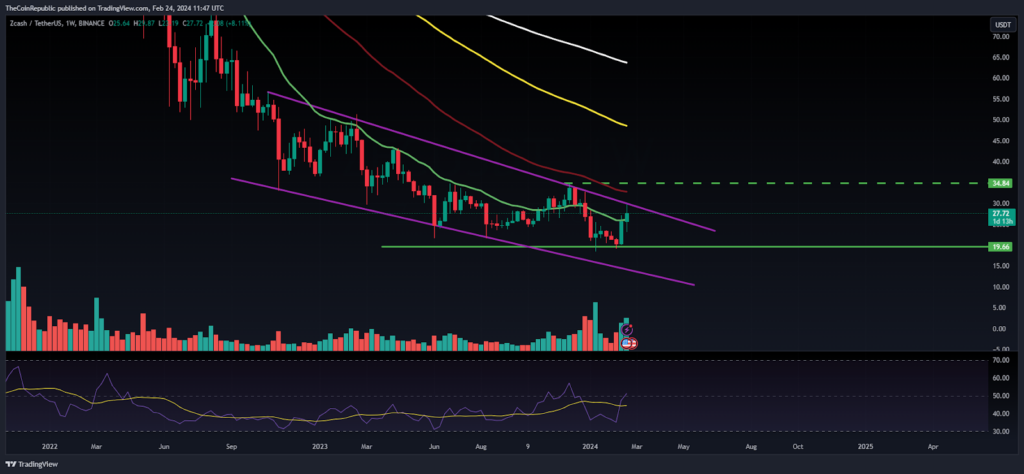
Zcash price was in a correction phase and persisted in forming the lower low swings and reached the low of $20. However, a bullish engulfing candlestick was made at the bottom, and buyers succeeded in stretching the pullback and escaped the 20 day EMA mark. Afterward, the reversal continued, and buying momentum was witnessed in the last sessions. Buyers are looking to exit out of the channel and are looking for a breakout above $35.
Summary
The Zcash (ZEC) coin has regained momentum and noted a pullback from the support zone of $20, resulting in splitting the neckline of $25.Furthermore, the buyers gave indications of long buildup activity and will soon reach the round mark of $40 in the upcoming sessions.
Technical Levels
Support Levels: $25 and $20
Resistance Levels:$35 and $40
Disclaimer
The views and opinions stated by the author or any other person named in this article are for informational purposes only and do not constitute financial, investment, or other advice.

Andrew is a blockchain developer who developed his interest in cryptocurrencies while pursuing his post-graduation major in blockchain development. He is a keen observer of details and shares his passion for writing, along with coding. His backend knowledge about blockchain helps him give a unique perspective to his writing skills, and a reliable craft at explaining the concepts such as blockchain programming, languages and token minting. He also frequently shares technical details and performance indicators of ICOs and IDOs.


