
 Home
Home News
News
- 1 IOTA price struggling to break resistance levels.
- 2 The crypto is trading above the key moving averages showcasing that bulls are active in crypto.
- 3 The bears are showing their strength and extending downward pressure.
IOTA price prediction shows that the price is currently not in the proper grasp of bulls and bears. However, the bulls and the bears are still fighting over the price. The crypto has been volatile over the last three months.
TradingView data shows that IOTA’s crypto price is trading at $0.2673 with an intraday drop of 2.43%, indicating a bullish trend. The 24-hour trading volume is 13.95 Million, and the market capitalization stands at $836.32 Million.
So far, it gave a negative return of 13.37% year-to-date. However, it grew by almost 72.06% in the last 6 months and in the last 3 months, it grew by almost 57.00%. Looking at the last months, it returned 8.23% and last week it returned 1.87%. However, the indicator summary on TradingView indicates buying signals.
Technical Analysis Of IOTA Crypto On Daily Time Frame
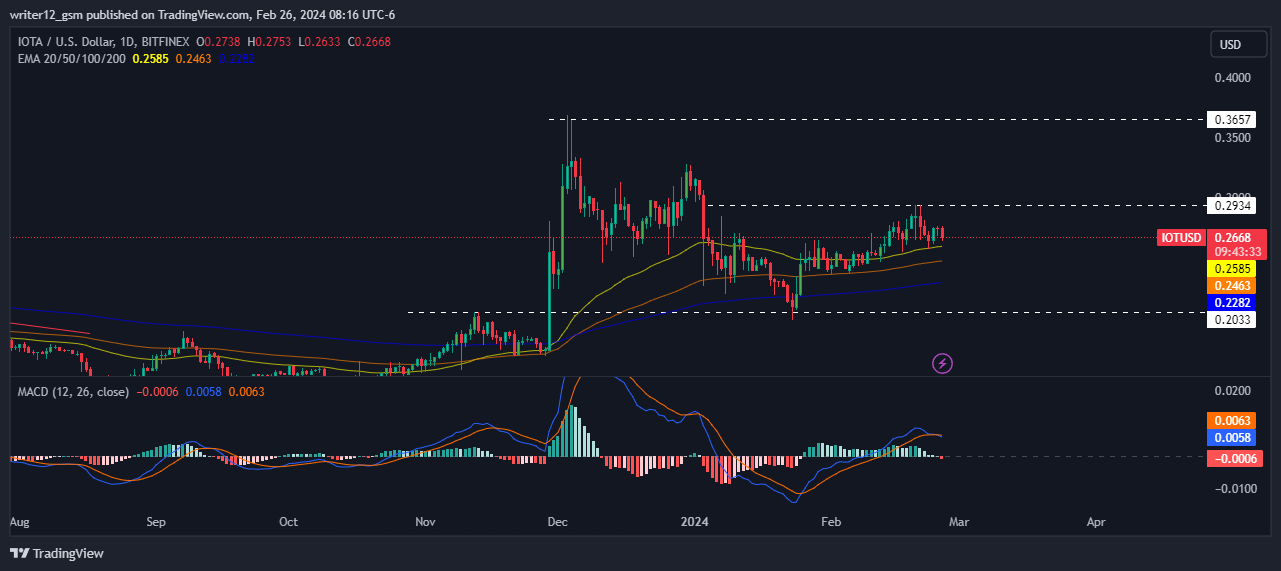
At the time of publishing, IOTA crypto (USD: IOTA) is trading above the 50 and 200-Day EMAs (Exponential moving averages), which are supporting the price trend.
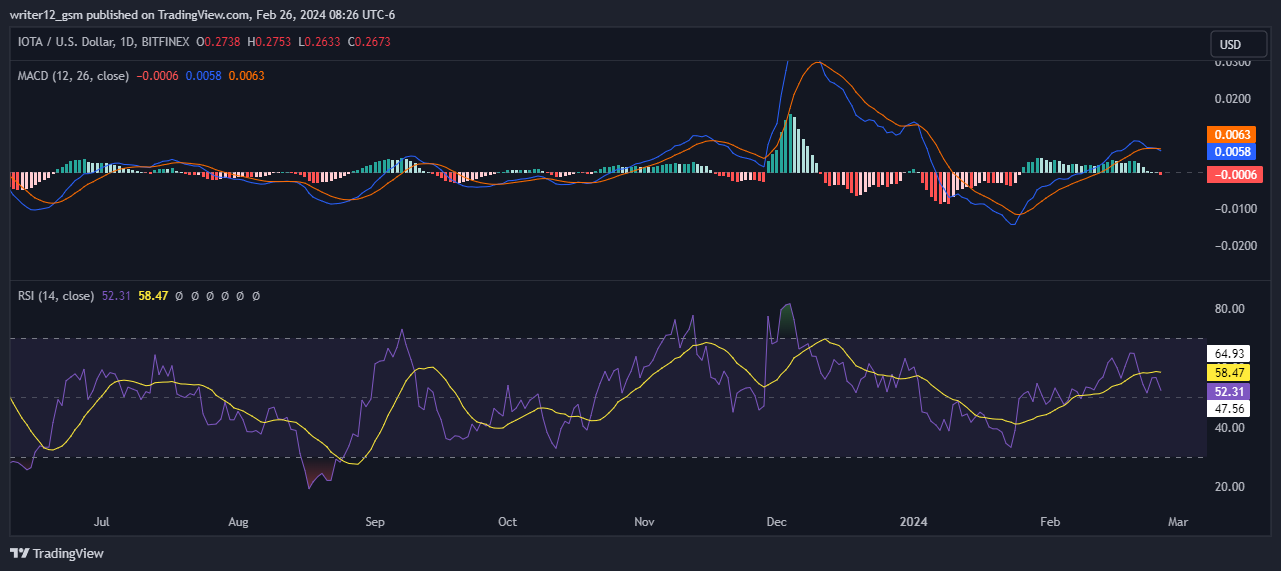
The MACD line at 0.0058 and the signal line at 0.0058 are above the zero line. A bearish crossover was observed in the MACD indicator which signals more bullishness for the IOTA crypto price.
Technical Analysis Of IOTA Crypto On 4-H Time Frame
IOTA Crypto seller’s strength and short-term charts showed negative outcomes in the crypto. Moreover, the price is trading above the major EMAs, indicating further weakness for the cryptocurrency.
The RSI curve is near 44.70, an overbought zone, with a negative outlook indicating bearish sentiment in the cryptocurrency chart. The MACD indicator also started to form a red band and a bearish crossover appeared, indicating a corrective move.
Technical Analysis Of IOTA Crypto On Weekly Time Frame
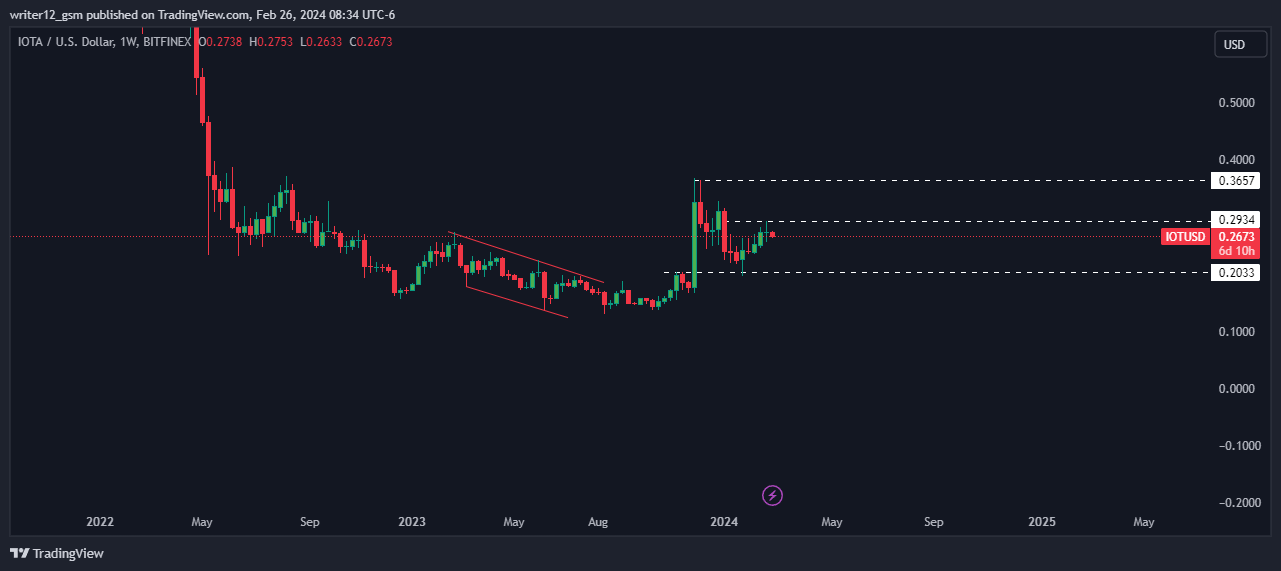
IOTA crypto’s weekly chart shows that buyers are dominating. The cryptocurrency is in an uptrend as it jumped above the main EMA.
Technical indicators also support the bullish sentiment as RSI is close to the overbought zone and MACD formed a bullish crossover with the green band. These signals indicate that the cryptocurrency could face even greater upward pressure in the coming weeks.
Summary
The daily time frame for IOTA crypto is showcasing neutrality and several technical indicators lend support to this neutral outlook. The RSI curve has climbed up from the neutral region, illustrating neutrality. This indicates a bullish outlook for the upcoming trading sessions.
Technical Levels
Support Levels: $0.2033.
Resistance Levels: $0.3657.
Disclaimer
This article is for informational purposes only and provides no financial, investment, or other advice. The author or any people mentioned in this article are not responsible for any financial loss that may occur from investing in or trading. Please do your research before making any financial decisions
Steve Anderson is an Australian crypto enthusiast. He is a specialist in management and trading for over 5 years. Steve has worked as a crypto trader, he loves learning about decentralisation, understanding the true potential of the blockchain.


