


VeChain (VET) price forecast suggests that the price is trading in the bullish zone with extreme bullish momentum. VET price was up 75.96% over the period of one month.
Over a week, VeChain crypto has experienced an increase of approximately 7.05%, and this incline has been steeper over a month, reaching around 75.96%. Looking back over three months, VET crypto has grown by about 128.63%, while the incline extended to around 191.77% over the last six months. Furthermore, the crypto’s performance throughout the year has been outstanding, with a year-to-date slump of approximately 39.97%.
At press time, the VeChain crypto price was $0.04796861, with an intraday gain of 7.85%, showing bullishness on the chart. Moreover, the trading 24-hour volume is $142.12 Million. The market cap is $3.53 Billion. Moreover, analysts maintained a strong buy rating for the crypto.
Technical data on TradingView shows that out of 26 indicators, 0 are on the sell side, 9 are on the neutral side, and 17 are on the buying side showing an extremely bullish perspective.
Technical Analysis of VeChain Crypto Price in 1-D Timeframe
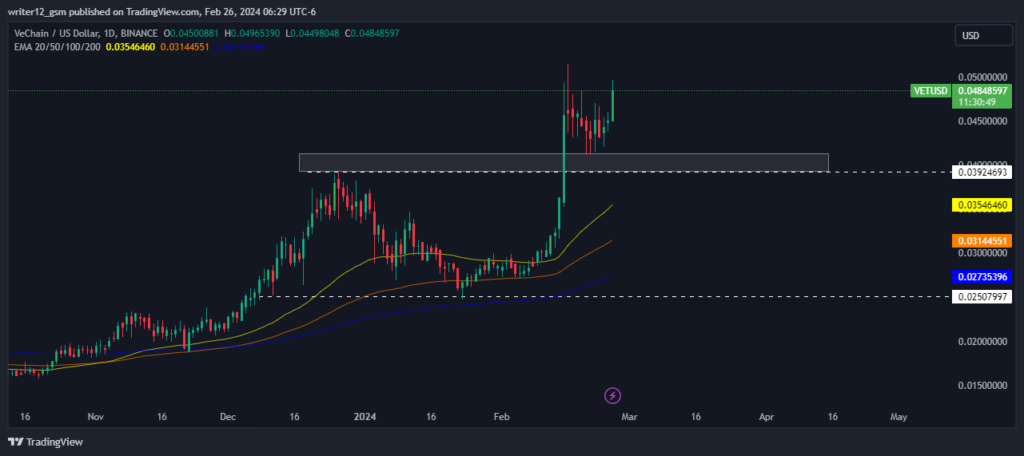
VeChain (USD: VET) crypto price rose steadily for the past three months, gaining 128.37%. At the time of writing, VET crypto is trying to surge above the upper level after a pullback.
If the VeChain price can maintain its current level, it has the potential to continue rising and reach its first and second targets of $0.05500000 and $0.06000000 respectively. However, if the price drops, it may hit the nearest support levels of $0.03546812 and $0.03145742.
As of now, VeChain crypto (USD: VET) is trading above both the 50 and 200-Day SMAs (Simple Moving Averages), indicating a positive price trend. If the buying volume increases, the price could potentially surpass the upper levels, resulting in a bullish outlook over the daily timeframe chart.
The current value of RSI is 76.79 points. The 14 SMA is above the median line at 77.06 points which indicates that the VeChain crypto is bullish.
The MACD line at 0.00424157 and the signal line at are above the zero line. A bearish crossover is observed in the MACD indicator which signals more bearishness for the VET crypto price.
Summary
VeChain (USD: VET) technical oscillators also support the bearish trend. The MACD, RSI, and EMA are highlighting adverse indications and suggest that the negative trend may continue in the VET crypto price. Moreover, VeChain crypto can go high if it gets the desired support from buyers. Meanwhile, VeChain crypto needs buyers to push the crypto VeChain price towards the recovery phase. However, the VeChain crypto price is horizontally range-bound.
Technical Levels
Support Levels: $0.03546812 and $0.03145742
Resistance Levels: $0.05500000 and $0.06000000


