
 Home
Home News
News
- 1 DOT coin reflects a pullback and is heading toward the $10 mark.
- 2 Buyers have gained momentum and are accumulating.
Polkadot coin (DOT) price signifies a sharp rebound from the 200-Day EMA mark near $6 and jumped over 40% this week. The price action indicates that the DOT coin has gained momentum, and fresh buying interest is reflected on the charts. Furthermore, the bulls have acquired strength and are looking to achieve the $10 mark.
The DOT coin price has escaped the key moving averages and replicates bullish cues and investor interest in the past sessions. The coin has jumped massively from the support zone of $6 and surged over 40% in the last weeks. Additionally, the trend is intact, and the coin may continue to sprinkle the rebound. Per the Fibonacci retracement levels, the coin has jumped above the 38.2% zone, displaying bullishness.
The Polkadot coin (DOT) price was $8.47 at press time, with an intraday gain of 4.07%, showing neutrality on the charts. Moreover, the trading volume has increased by 9.12% to $426.65 Million. The pair of DOT/BTC is at 0.000144 BTC, and the market cap is $11.79 Billion. Analysts are bullish and suggest that the DOT price will continue to gain momentum and may surpass $10 soon.
Polkadot Displays Rebound, Can DOT Reach $10 Mark?
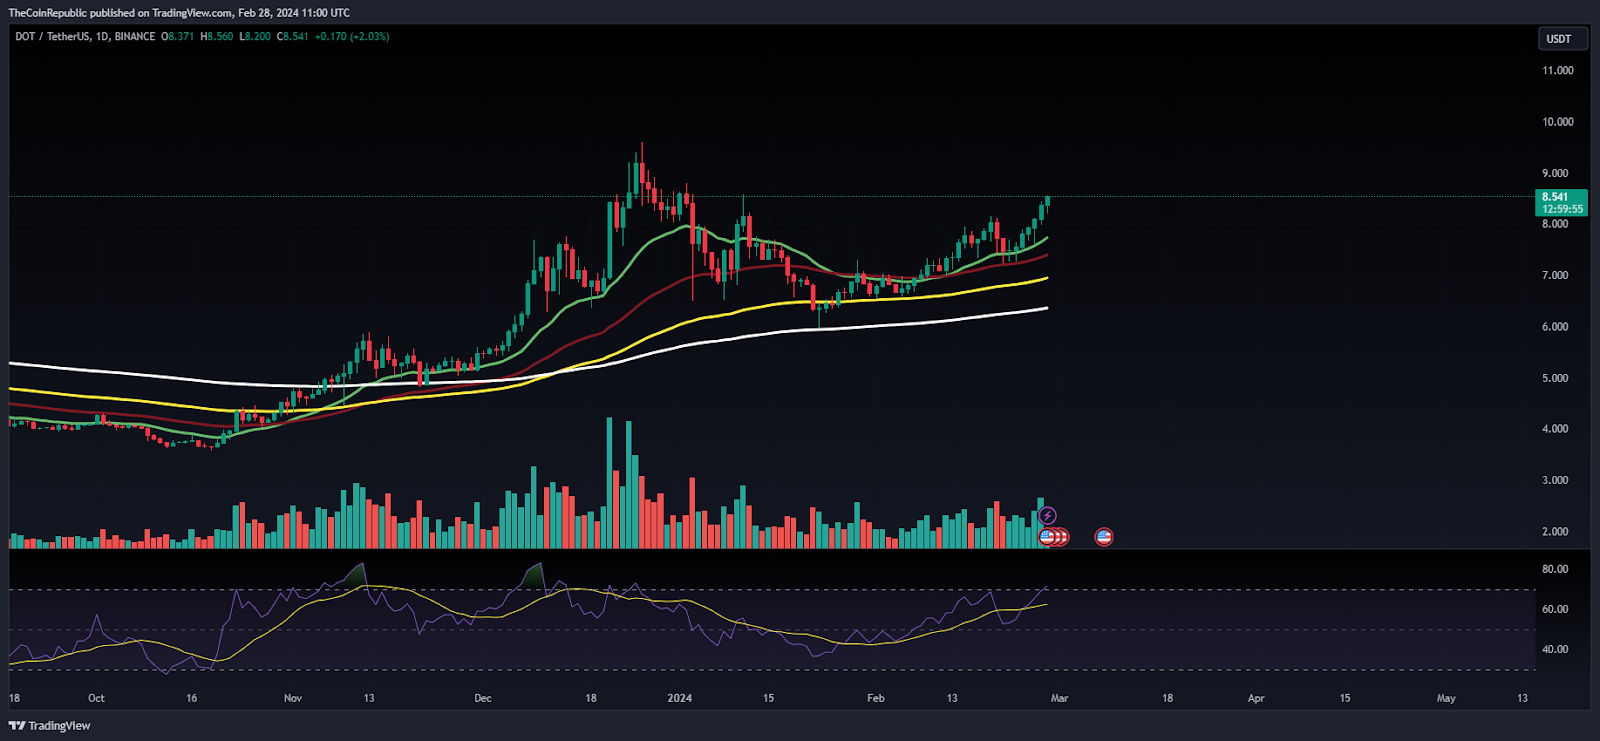
On the daily charts, the coin has reflected a sharp comeback, and a follow-on buying momentum was witnessed. Furthermore, the coin exited the consolidation phase and completed its retracement in the last few sessions. The price action signifies the higher high swings and is climbing away from the key EMA levels, highlighting bulls’ strength and willingness to claim $10 soon.
The RSI curve stayed in the overbought zone and formed a positive crossover, signifying the buying momentum on the charts. Similarly, the MACD shows a bullish crossover, reflecting outperformance on the charts.
Polkadot Gained Momentum, Can DOT Surpass The 100-Day EMA Hurdle?
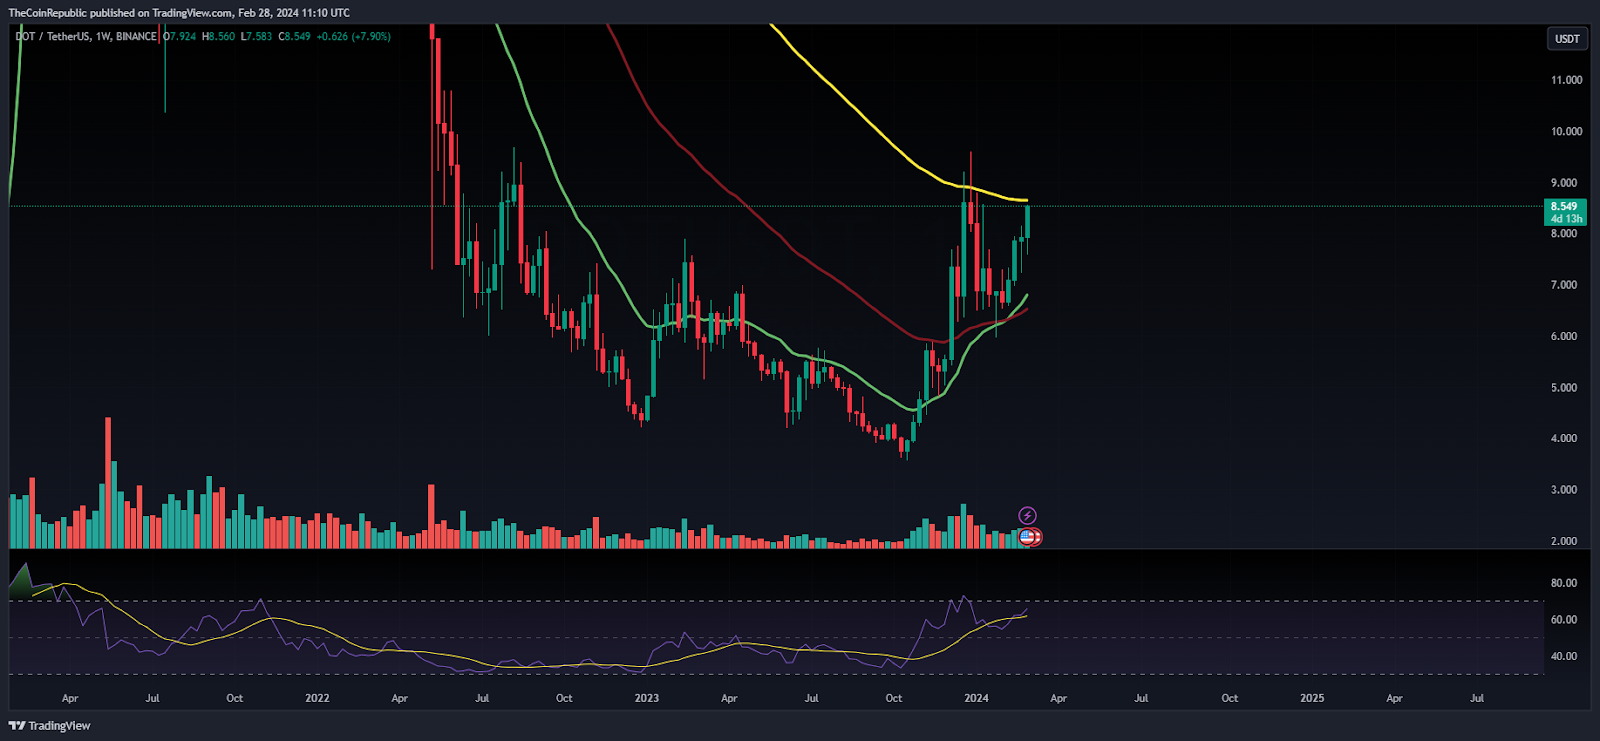
On the weekly charts, the coin has reverted from the lows of $3.50, reflecting a sharp comeback in the past few sessions. However, the 100-Day EMA barrier is yet to be crossed and if bulls surpass it, a strong bullish rally will be seen in the coming sessions. Conversely, if DOT is rejected at $9, it may retrace toward $7 in the following sessions. Moreover, the sellers are looking in trouble, and short covering moves were witnessed on the charts.
Summary
The Polkadot (DOT) crypto price signifies a buying momentum, has jumped above the primary hurdle of $7.50, and is revealing outperformance on the charts. Moreover, the coin has surpassed the key EMA level, and bulls are keen to spread the rebound toward $10 soon.
Technical Levels
Support Levels: $8 and $7.30
Resistance Levels:$9 and $10
Disclaimer
The views and opinions stated by the author or any other person named in this article are for informational purposes only and do not constitute financial, investment, or other advice.
Anurag is working as a fundamental writer for The Coin Republic since 2021. He likes to exercise his curious muscles and research deep into a topic. Though he covers various aspects of the crypto industry, he is quite passionate about the Web3, NFTs, Gaming, and Metaverse, and envisions them as the future of the (digital) economy. A reader & writer at heart, he calls himself an “average guitar player” and a fun footballer.


