
 Home
Home News
News
- 1 Mina coin price chart signals neutrality as it hovers near the 20-Day EMA mark.
- 2 Buyers are looking for a bounce to retest the immediate hurdle of $1.50.
Mina coin (MINA) price signifies rejection from the make-or-break region of $1.50, and retracement was witnessed in the last few sessions. However, the technicals are replicating a neutral outlook, and the coin may attain a bounce soon. Moreover, the price action signifies a recovery from the round mark of $1.00. Additionally, the coin took support on the 50-Day EMA mark and indicated a trend reversal.
MINA price has escaped the trajectory hurdle of $1.00, retained the bullish region, recovered over 300% in the previous three months, and is still likely to hit $1.70. Moreover, the coin has been replicating buying interest and short-covering moves in the past weeks. The coin may retain the highs of $1.50, gain momentum, and rally toward $2.00 in the upcoming weeks. Per the Fib retracement levels, the coin has escaped the 23.6% zone and may surpass the 38.2% zone.
The Mina coin (MINA) price was $1.30 at press time, with an intraday drop of 2.10%, showing neutrality on the charts. Moreover, the trading volume has increased by 3.20% to $60.93 Million. Mina coin has a monthly return ratio of 26.71% and 43.80% on a monthly basis, revealing a neutral outlook. The pair of MINA/BTC is at 0.0000223 BTC, and the market cap is $1.38 Billion. Analysts are bullish and suggest that the Mina coin (MINA) price will soon retest the supply zone of $1.60.
MINA Displays Rounding Bottom Formation On Daily Charts
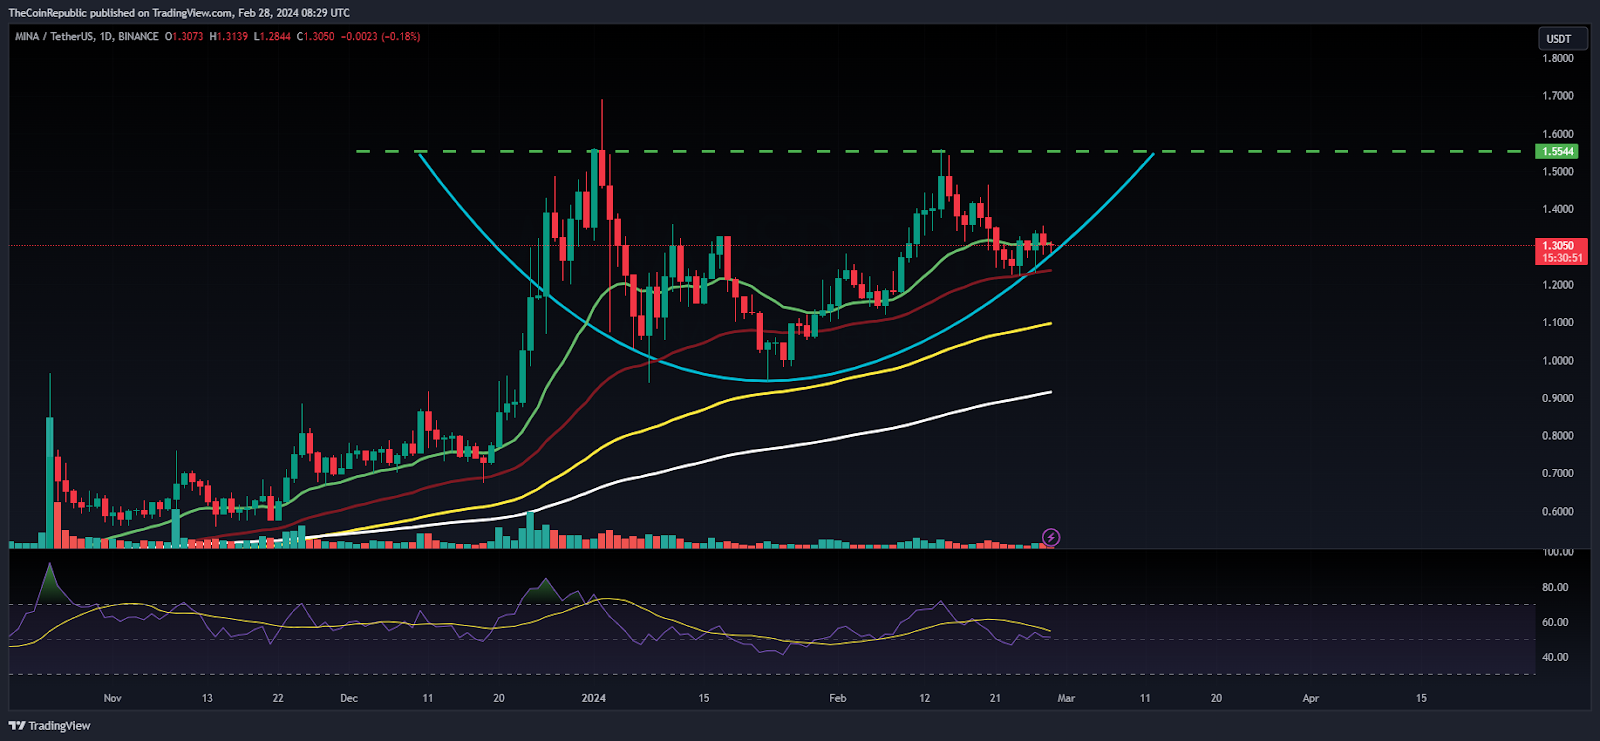
On the daily charts, the coin trades close to the support region and displays a rounding bottom formation, which suggests that the coin may attain a bounce soon. Moreover, the coin depicts higher high swings and is ready for a significant rise to $1.50.
The Relative Strength Index (RSI) curve stayed near the midline and witnessed a negative crossover, signifying the profit booking in the last sessions. Similarly, the MACD indicator shows a bearish crossover, and forming red bars on the histogram replicates volatility on the charts.
MINA Exhibits Buyer Accumulation On Weekly Charts
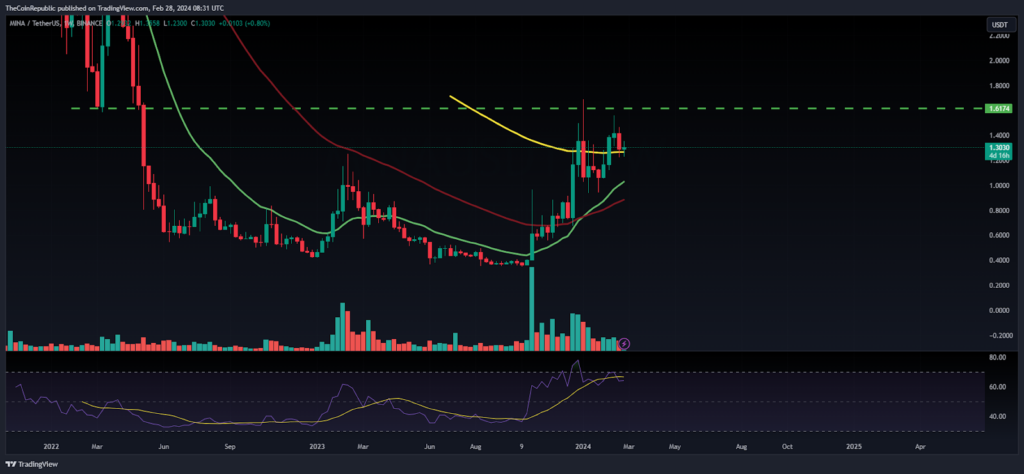
Mina coin price has decisively sustained gains above the 100-Day EMA mark and is waiting for a significant bounce to catch the supply region of $1.60. Amidst the market surge, the coin is still hovering in a range and is ready to spark bullishness.
Summary
The Mina coin (MINA) price chart shows a rounding bottom formation depicting neutrality and is ready to surpass the resistance zone of $1.60. Furthermore, the price action conveys the investor interest, and the coin may acquire buying momentum in the following sessions.
Technical Levels
Support Levels: $1.20 and $1.00
Resistance Levels:$1.60 and $2.00
Disclaimer
The views and opinions stated by the author or any other person named in this article are for informational purposes only and do not constitute financial, investment, or other advice.

Andrew is a blockchain developer who developed his interest in cryptocurrencies while pursuing his post-graduation major in blockchain development. He is a keen observer of details and shares his passion for writing, along with coding. His backend knowledge about blockchain helps him give a unique perspective to his writing skills, and a reliable craft at explaining the concepts such as blockchain programming, languages and token minting. He also frequently shares technical details and performance indicators of ICOs and IDOs.


