
 Home
Home News
News
- 1 MANA price forecast suggests an uptrend in the price, supporting the bullish trend.
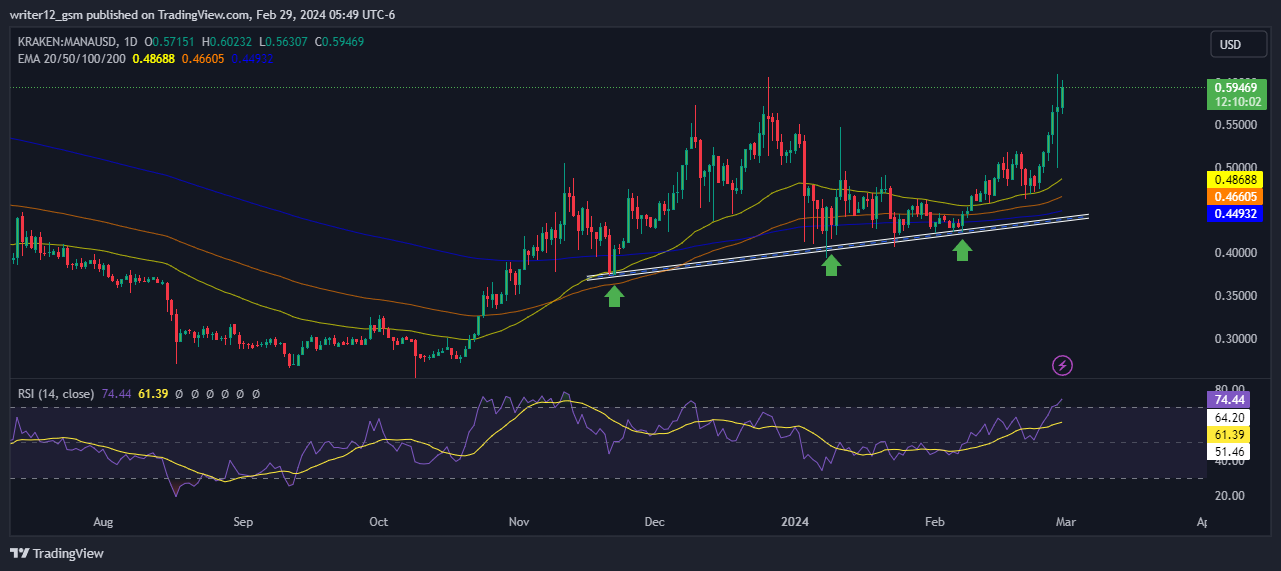
- 2 Decentraland price is trading above the key moving averages of 20, 50, 100, and 200-Day EMAs.
MANA price forecast highlights the bullishness in the price heading towards the $0.7000 level. The crypto price rose by almost 22.22% this week as bulls support the price and the indicators highlight it as a strong buy.
Over the week, Decentraland crypto experienced an increase of approximately 24.05%, and this incline turned into 30.13% over the month. Looking back over three months, MANA cryptos have gained by about 38.47%, while the incline extends to around 103.04% over the last six months. Furthermore, the crypto’s returns throughout the year are lackluster, with a year-to-date slump of approximately 14.42%.
At press time, the Decentraland crypto price was $0.59469, with an intraday gain of 4.07%, showing bullishness on the technical charts. Moreover, the trading volume is $228.22 Million. The market cap is $1.14 Billion. Moreover, indicators maintained a strong buy rating.
TradingView indicator summary shows that out of 26 indicators, 0 are on the selling side, 9 are on the neutral side and 17 are on the buying side.
Technical Analysis of Decentraland Crypto Price in 1-D Timeframe
Decentraland (USD: MANA) has seen its crypto price rise steadily for the past three months, gaining 38.28%. At the time of writing, MANA is trying to hold on to this level after a pullback.
If it can stay at this level, Decentraland price could continue to go up and reach the first and second targets of $0.60000 and $0.70000 respectively. However, if the MANA price cannot maintain this level and falls, then it might hit the closest support levels of $0.48688 and $0.44932 respectively.
At the time of publishing, Decentraland crypto (USD: MANA) is trading above the 50 and 200-Day SMAs (Simple moving averages), which are supporting the price trend.
However, if buying volume adds up then the price might reach higher levels by making higher highs and lows. Hence, the MANA price is expected to move upward giving bullish views over the daily time frame chart.
The current value of RSI is 74.44 points. The 14 SMA is above the median line at 61.39 points which indicates that the Decentraland crypto is bearish. The MACD line and the signal line are above the zero line. A bullish crossover is observed in the MACD indicator which signals more bullishness for the MANA crypto price.
Summary
Decentraland (USD: MANA) technical oscillators also support the bullish momentum. The MACD, RSI, and EMAs are giving positive indications and suggest that the bullish trend may continue in the MANA crypto price. Moreover, Decentraland crypto could go higher if it gets the desired support from buyers. Meanwhile, Decentraland crypto needs more buyers to push the crypto price towards the upper threshold.
Technical Levels
Support Levels: $0.48688 and $0.44932
Resistance Levels: $0.60000 and $0.70000
Disclaimer
This article is for informational purposes only and does not provide any financial, investment, or other advice. The author or any people mentioned in this article are not responsible for any financial loss that may occur from investing in or trading. Please do your own research before making any financial decisions.

Andrew is a blockchain developer who developed his interest in cryptocurrencies while pursuing his post-graduation major in blockchain development. He is a keen observer of details and shares his passion for writing, along with coding. His backend knowledge about blockchain helps him give a unique perspective to his writing skills, and a reliable craft at explaining the concepts such as blockchain programming, languages and token minting. He also frequently shares technical details and performance indicators of ICOs and IDOs.


