
 Home
Home News
News
Hedera Hashgraph (HBAR) is currently trading at the level of $0.1159, a drop of 3.36% in one day showing the bearishness in the intraday session.
Hedera Hashgraph (HBAR) is the public Hedera network’s native, eco-friendly cryptocurrency. HBAR is used to pay for network transactions and to secure the network through its proof-of-stake mechanism. HBAR has a fixed total supply of 50 billion coins and can be bought on several exchanges. The symbol for HBAR is a lowercase italicized ‘H’ (ℏ).
HBAR is used to pay for network services such as sending HBAR, creating fungible and non-fungible tokens, executing smart contracts, and storing data. The Hedera proof-of-stake public network, powered by hashgraph consensus, achieves the highest level of security possible (ABFT), with ultra-fast transaction speeds and extremely low bandwidth consumption.
HBAR transactions achieve finality, ledger, within three to five seconds. The network achieves 10,000 HBAR cryptocurrency transactions per second, with transaction fees of around $0.0001. Staking HBAR to a Hedera network node can earn up to 6.5% APY and will maintain the security of Hedera’s network operations.
Hedera (HBAR) Price Overview
The trading volume of HBAR is $116.2 Million in the last 24 hours, representing a 51.70% decrease from one day ago and signaling a recent fall in market activity.
The highest price paid for HBAR is $0.5692, which was recorded on Sep 15, 2021 (over 2 years). Comparatively, the current price is 79.67% lower than the all-time high price.
The lowest price paid for HBAR is $0.009861, which was recorded on Jan 02, 2020 (about 4 years). Comparatively, the current price is 1,073.29% higher than the all-time low price.
The market capitalization of HBAR is $3.91 Billion. The fully diluted valuation (FDV) of HBAR is $5.80 Billion. This is a statistical representation of the maximum market cap, assuming the maximum number of 50 Billion HBAR tokens are in circulation today. Depending on how the emission schedule of HBAR tokens is designed, it might take multiple years before FDV is realized.
Hedera (HBAR) Price Technical Analysis
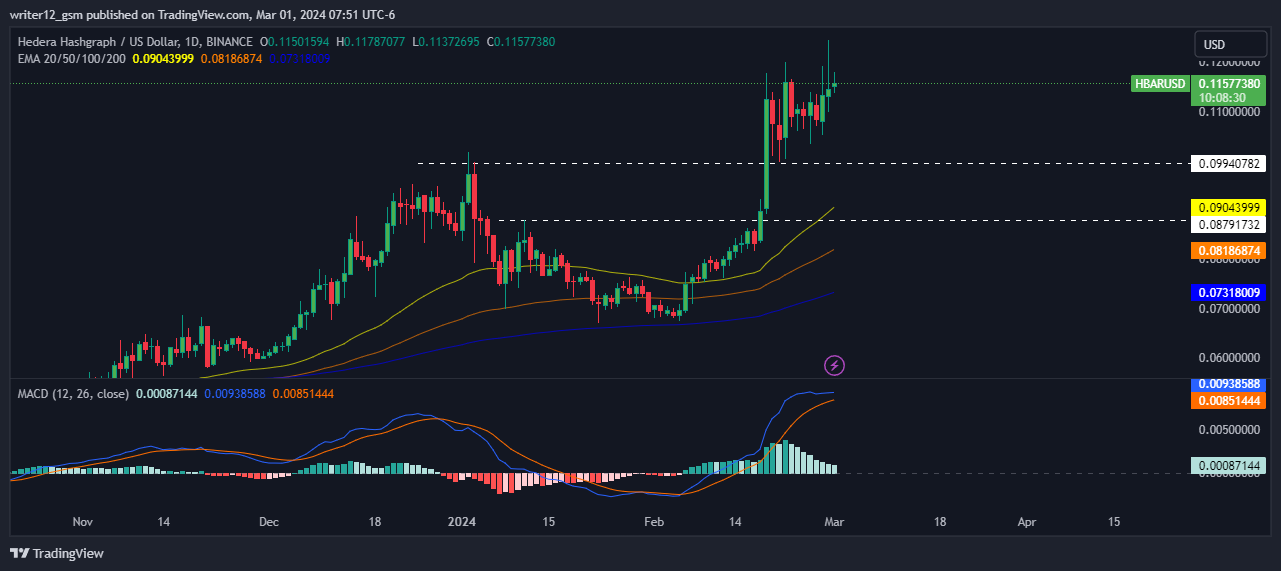
On the daily technical chart, the HBAR price is heading upward and trading above the 20, 50, 100, and 200-Day EMAs. The RSI curve is hovering in the bullish zone, indicating bullishness while the MACD curve also signals bullishness in the crypto price. Overall, the key indicators indicate the bullishness in the HBAR price.
As per the CoinMarketCap data, the current price of HBAR is $0.1159, after a drop of 3.36% in one day. The market cap of MANTA is $3,903,174,201, with a 24-hour volume of $120,621,369.
The past 24-hour volume/ market cap ratio of HBAR is recorded at 3.09%. Furthermore, MANTA’s all-time high price was recorded at $0.5701 on September 16, 2021, whereas the all-time low was documented at $0.01001 on January 03, 2020.
Summary
HBAR’s daily technical chart shows an upward trend with bullish indicators such as RSI and MACD, suggesting a positive market sentiment. Moreover, the price is trading far above the key moving averages highlighting the bullishness.
Technical Levels
Support Levels: $0.09940782
Resistance Level: $0.13000000
Disclaimer
This article is for informational purposes only and does not provide any financial, investment, or other advice. The author or any people mentioned in this article are not responsible for any financial loss that may occur from investing in or trading. Please do your own research before making any financial decisions.

Nancy J. Allen is a crypto enthusiast, with a major in macroeconomics and minor in business statistics. She believes that cryptocurrencies inspire people to be their own banks, and step aside from traditional monetary exchange systems. She is also intrigued by blockchain technology and its functioning. She frequently researches, and posts content on the top altcoins, their theoretical working principles and technical price predictions.


