
 Home
Home News
News

- 1 APE price gave a range breakout and is signifying a bullish trend.
- 2 The coin price surpassed the $2 mark and is reflecting a rise.
Apecoin flashed signs of rebound and moved out of the range, gaining over 40% this week, replicating bullish momentum on the charts. APE price has escaped the hurdle of $2 and is sprinting to exhibit further delights soon. Moreover, the Apecoin price action suggests a rise and is ready to deliver in the upcoming sessions. The technicals indicate the beginning of an uptrend, and signs of fresh buying momentum were exhibited.

Apecoin price has escaped above the key moving averages and depicts bullish sentiments. For the past weeks, the Apecoin price has been in a narrow range, and attempts to flee the range were unsuccessful. However, the dream came true, and bulls enjoyed the breakout, leading the APE price above the bars and revealing bull accumulation.

The Apecoin (APE) price was $2.22 at press time, with an intraday drop of 3.24%, showing neutrality on the charts. Moreover, the trading volume has increased by 12.98% to $167.86 Million. The pair of APE/BTC is at 0.000000358 BTC, and the market cap is $289.65 Million. Apecoin has a weekly return ratio of 25.65% and 47.89% on a monthly basis, revealing a bullish outlook. Analysts are bullish and suggest that the Apecoin crypto (APE) price has given a range breakout and will skyrocket in the upcoming sessions.
Apecoin Glimpse Range Breakout On Daily Charts, What’s Next?
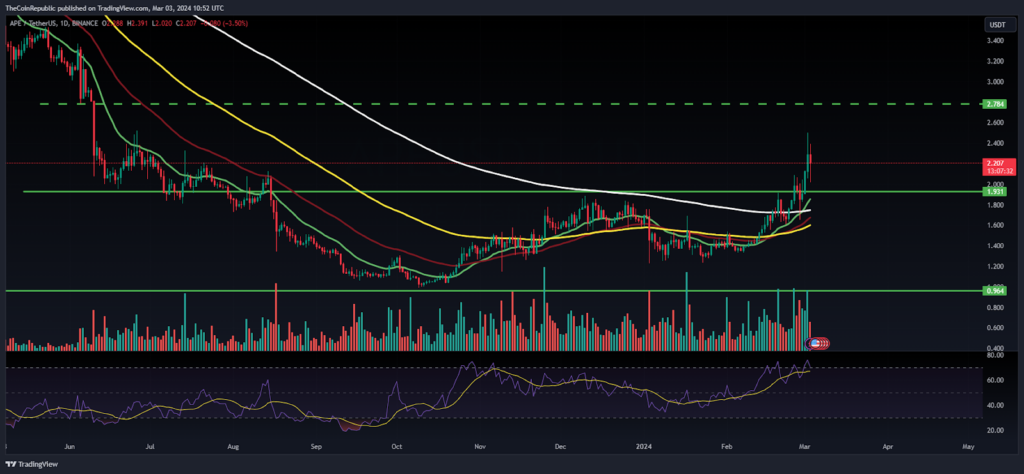
The Apecoin price has picked strength on the daily charts and delivered higher high swings, exhibiting the follow-on buying momentum. APE price has come out from the long-term consolidation, and bulls are keen to lead Apecoin toward $3 in the following sessions. Apecoin crypto signals the end of retracement and has moved out of the range, which might lead to a bullish trend ahead.
The RSI curve is floating near 70 in the overbought zone, revealing the bullish outlook on the charts. Similarly, the MACD indicator depicts a bullish crossover and signs of bull accumulation. Per the Fib levels, the APE price has escaped the 38.2% zone and is heading to the 50% zone.
Apecoin Retested 50 Day EMA Mark, Can Bulls Cross The Hurdle?
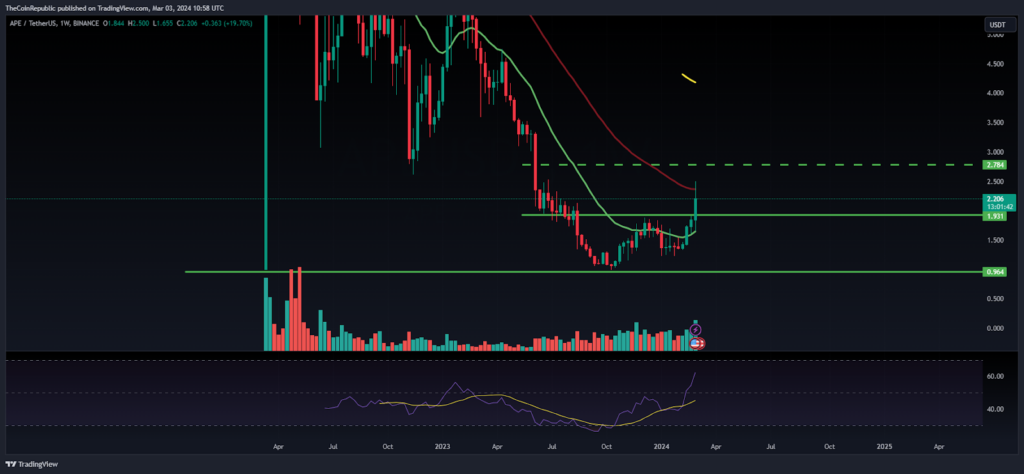
On the weekly charts, Apecoin has bounced from the demand zone of $1 and soared over 80% in the last 20 trading sessions. Following the market surge, a glimpse of buying momentum led the APE price from the base to the highs and reverted the trend, which led the seller into trouble. As per Coinglass data, the open interest increased by 20% to $98.20 Million, and an increase in price with an increase in volume was noted,
Summary
The Apecoin price has moved out of the range and crossed a significant hurdle of $2, which signals a bullish trend ahead. Moreover, the trend is intact, and the APE price might reach the upside of $3 in the following sessions.
Technical Levels
Support Levels: $2 and $1.80
Resistance Levels:$2.70 and $3
Disclaimer
The views and opinions stated by the author or any other person named in this article are for informational purposes only and do not constitute financial, investment, or other advice.

Nancy J. Allen is a crypto enthusiast, with a major in macroeconomics and minor in business statistics. She believes that cryptocurrencies inspire people to be their own banks, and step aside from traditional monetary exchange systems. She is also intrigued by blockchain technology and its functioning. She frequently researches, and posts content on the top altcoins, their theoretical working principles and technical price predictions.


