
 Home
Home News
News
- 1 The DEXTools token price witnessed a retracement from the $1 mark.
- 2 Bulls are holding the 20-day EMA mark and are looking for a pullback.
DEXTools token (DEXT) price was in an uptrend and is glimpsing bullish sentiments on the charts. The token depicted a rising channel and persisted in delivering the higher high swings for the past weeks. Additionally, the token has succeeded in retesting the $1 mark but could not surpass it and faced rejection. The price action signifies a long rejection wick from the 100-day EMA and reflects that bulls have still held their strength and may successfully cross the $1 mark soon.
DEXT price has retested the 20-day EMA mark, signifying the retracement phase. The price action signifies the neutrality and volatility moves reflected in the last session, conveying the dilemma among the investors. If the token retains the $1 mark, the short covering may trigger an up move, whereas if it slips below the 20-day EMA, the token may slide to the $0.800 mark, the lower trendline support zone.
The DEXTools token (DEXT) price was $0.9751 at press time, with an intraday gain of 0.71%, showing neutrality on the charts. Moreover, the trading volume has increased by 160.97% to $1.37 Million. The Filecoin price has a weekly return ratio of 26.46% and 103.78% on a monthly basis. The pair of DEXT/BTC is at 0.000154 BTC, and the market cap is $91.25 Million. Analysts are neutral and suggest the DEXT token may face some profit booking and volatility in the next sessions.
DEXTools Reveals Rejection From Supply Zone: What’s Next?
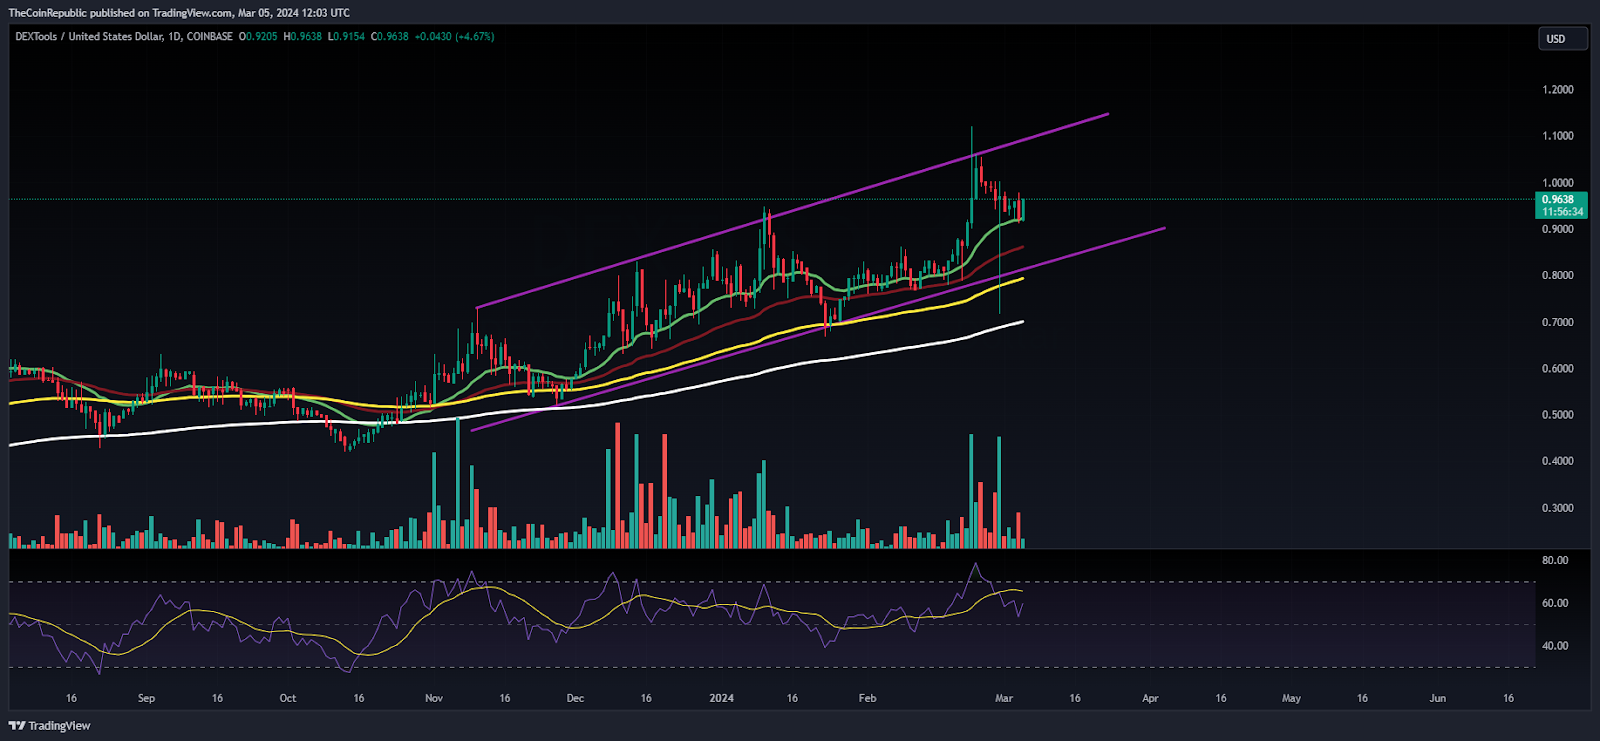
On the daily charts, the DEXT token price was in an uptrend and has attained buying momentum in the past weeks. The token has reverted from the demand zone of $0.5000 and retained 70% of gains in the last three months. However, the trend is neutral, and bulls must sustain above the $1 mark to retain the bullishness.
The Relative Strength Index (RSI) curve slips from the overbought zone to the signal line and depicts a negative divergence, which may trigger some profit bookings soon. Moreover, the MACD indicator shows a convergence of the signal line with the MA line, reflecting the indecisiveness between the bulls and bears.
DEXT Exhibits Pullback: Can DEXT Retain $1 Mark?
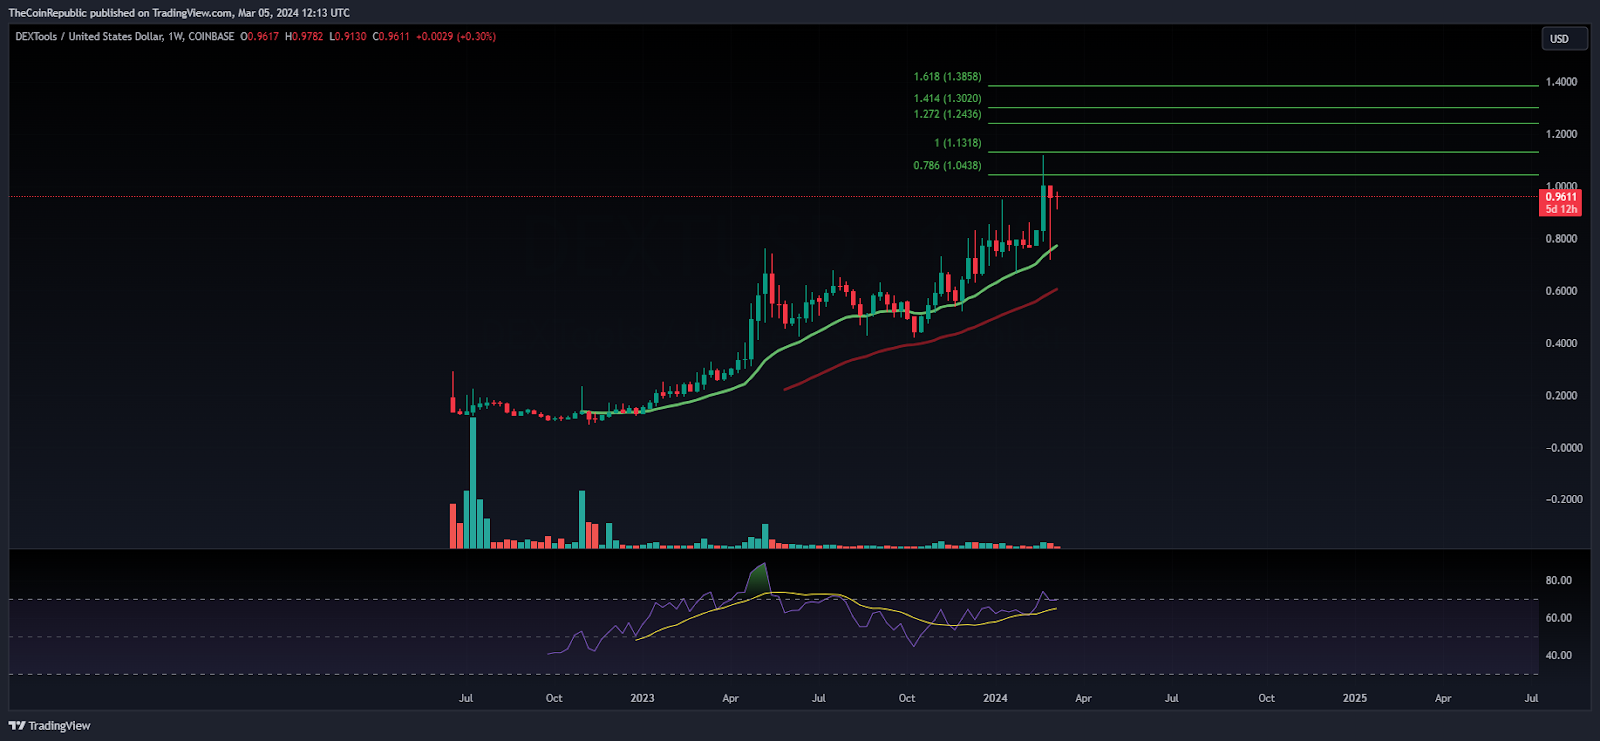
The DEXT token continued to rise on the weekly charts and delivered a bullish outlook for the past weeks. The token persisted in getting a bounce from the 20-day EMA mark and forming the higher high swings. Recently, the token has retested the $1 mark but failed to overtake and faced rejection. However, the sell-off has yet not triggered, and volatility may be seen in the next sessions.
Summary
The DEXTools token (DEXT) price has held the gains near the 20-day EMA support mark and is attempting a pullback. However, the $1 mark is the make-or-break zone for the Bulls to register a major breakout, which may be overtaken soon.
Technical Levels
Support Levels: $0.9400 and $0.9000
Resistance Levels:$1.0400 and $1.1300
Disclaimer
The views and opinions stated by the author or any other person named in this article are for informational purposes only and do not constitute financial, investment, or other advice.
Steve Anderson is an Australian crypto enthusiast. He is a specialist in management and trading for over 5 years. Steve has worked as a crypto trader, he loves learning about decentralisation, understanding the true potential of the blockchain.


