
 Home
Home News
News

- 1 The Ethereum coin price persists in skyrocketing gains and is resembling the bullish momentum.
- 2 A bounce from the 20-day EMA support mark lifted the ETH price above $3700 in the yesterday session.
The second largest cryptocurrency, Ethereum (ETH), displayed a massive surge and persisted in stretching the up move since the start of February. Ethereum price has surged over 70% in the last 45 days, revealing a bullish tone. The price action delivers the follow-on buying action, and a rising parallel channel was noted on the charts. ETH coin is eyeing to reclaim the $4000 mark and will split anytime this month.

Ethereum coin price has retained the bullish trajectory and is trading at its 52-week high range close to the $4000 mark. The intense rally fueled by the mighty bulls gave a surprising move for the investors who have held it for a long. In the last 45 trading sessions, a 40% increase in open interest was noted, implying the long buildup and sharp investors’ attention. Per the Fib levels, the ETH coin price has exceeded the 61.8% zone and is preparing to jump above the $4000 mark.

The Ethereum coin (ETH) price was $3877.89 at press time, with an intraday gain of 4.07%, showing bullishness on the charts. Moreover, the trading volume has increased by 61.90% to $46.11 Billion. The Ethereum price has a weekly return ratio of 19.66% and 69.44% on a monthly basis. The pair of ETH/BTC is at 0.0580 BTC, and the market cap is $473.56 Billion. Analysts are bullish and suggest that the Ethereum coin has reached the 52-week high range and will continue to skyrocket gains in the following sessions.
Ethereum (ETH) Rides on a Bullish Track, Next Stop $4500?
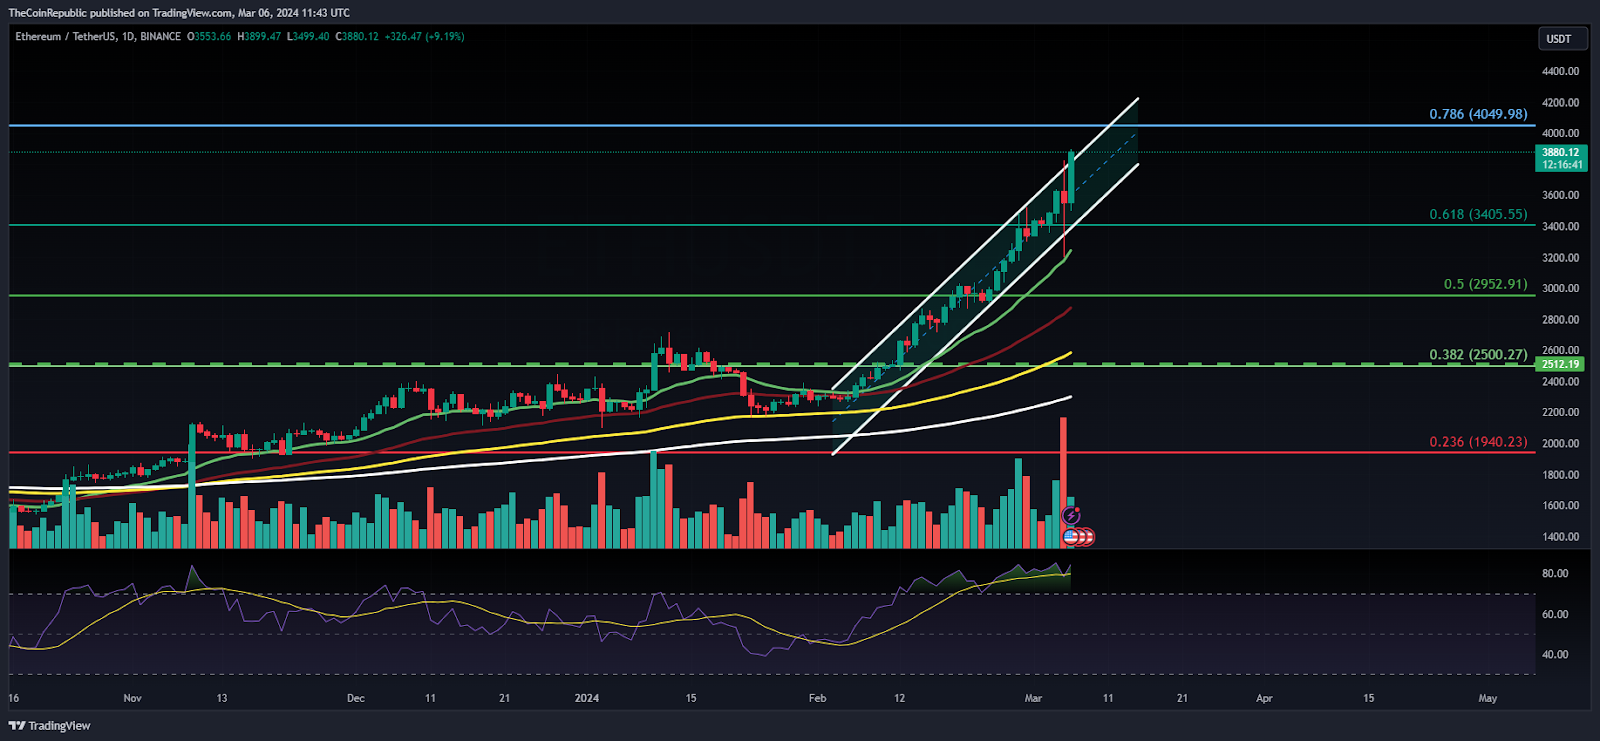
The chart displays a rising parallel channel, and higher high swings were portrayed for the past weeks. The trend is bullish, and buyers have continued to lift the ETH price, where the bears are looking trapped, which replicated a massive short-covering move. Additionally, the sentiments are positive, institutional buying cues were noted, and an enormous rise in volume was spotted on the charts.
The Relative Strength Index (RSI) curve floating near 80 depicts a bullish momentum, conveying the uptrend. Similarly, the MACD indicator shows a bullish crossover and represents the green bars on the histogram, signifying the outperformance.
Ethereum (ETH) Displays Three White Soldier Formation on Weekly Charts
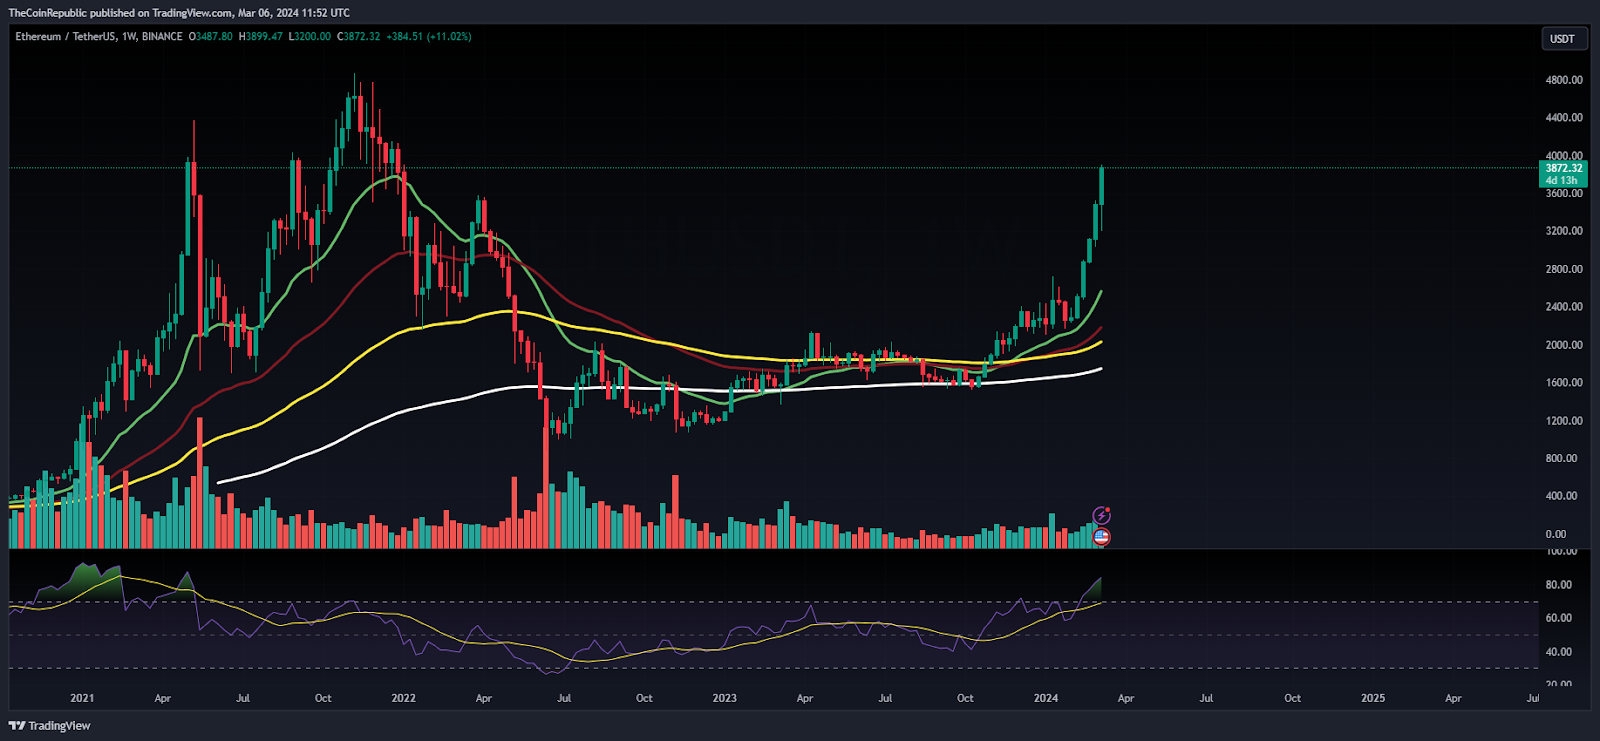
A golden crossover was noted on the weekly charts, and the coin glimpsed a sharp rally of over 60% in the past three weeks. Additionally, three white soldier pattern were noted and huge bullish marubozu candlesticks stepped up the Ethereum price away from the sellers’ vision. The trend is intact, and buyers are aggressively making long positions, which may soon trigger the $4000 mark.
Summary
The Ethereum (ETH) coin witnessed a sharp spike and retained the 52-week high trajectory above $3000 in the past sessions. The trend is bullish, and the derivative market displayed a massive long buildup activity, which signifies investor interest.
Technical Levels
Support Levels: $3500 and $3300
Resistance Levels: $4000 and $4400
Disclaimer
The views and opinions stated by the author or any other person named in this article are for informational purposes only and do not constitute financial, investment, or other advice.
Anurag is working as a fundamental writer for The Coin Republic since 2021. He likes to exercise his curious muscles and research deep into a topic. Though he covers various aspects of the crypto industry, he is quite passionate about the Web3, NFTs, Gaming, and Metaverse, and envisions them as the future of the (digital) economy. A reader & writer at heart, he calls himself an “average guitar player” and a fun footballer.


