
 Home
Home News
News

- 1 The Injective Protocol price is trading above the key moving averages, showcasing that the trend is still bullish.
- 2 INJ’s price is currently trading in between the price range of $45.00 to $30.00.
The Injective Protocol price is currently trading between $45.00 to $30.00, while staying above the key moving averages, indicating a bullish trend.
TradingView data shows that Injective Protocol’s crypto price is trading at $39.023 with an intraday gain of 2.64%, indicating a bullish trend. The 24-hour trading volume stood at $422.50 Million, and the market capitalization stood at $3.61 Billion.

Technical Analysis Of Injective Protocol Crypto On Daily Time Frame
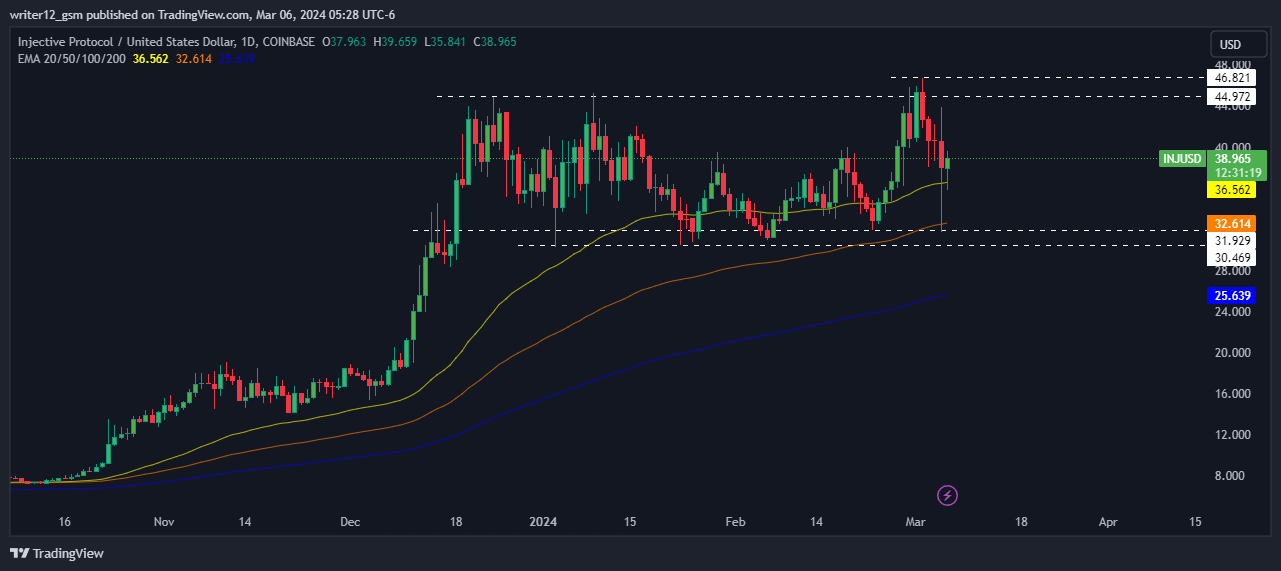
At the time of publishing, Injective Protocol crypto (USD: INJ) is trading above the 50 and 200-Day EMAs (exponential moving averages), which are supporting the price trend.
The current value of RSI is 51.55 points. The 14 SMA is above the median line at 55.46 points which indicates that the Injective Protocol crypto is neutral.
The MACD line at 1.348 and the signal line at 1.362 are above the zero line. A bearish crossover is observed in the MACD indicator which signals mild bearish for the INJ crypto price.
Technical Analysis of Injective Protocol Crypto On 4-H Time Frame
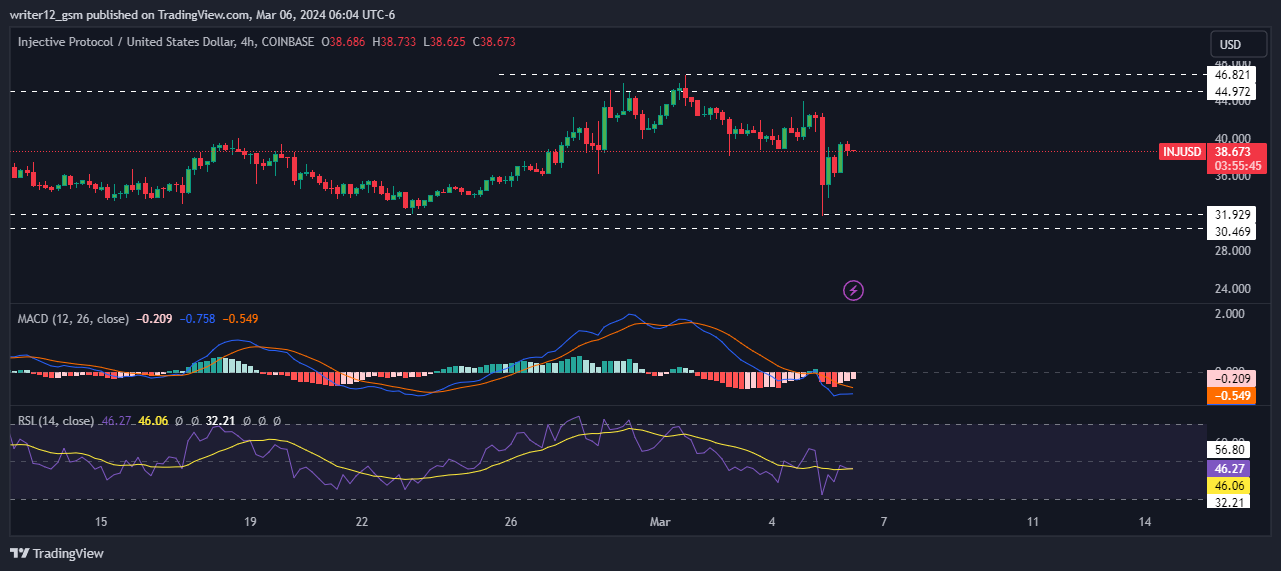
Injective Protocol crypto showed sellers’ strength and short-term charts showed unfavorable outcomes in the crypto. Moreover, the price is trading below the major EMAs, indicating further weakness for the cryptocurrency.
The RSI curve is near 45, below the middle line, with a negative outlook indicating bearish sentiment in the cryptocurrency. The MACD indicator also continued to form a red band and a bearish crossover appeared, indicating a corrective move.
Technical Analysis Of Injective Protocol Crypto On Weekly Time Frame
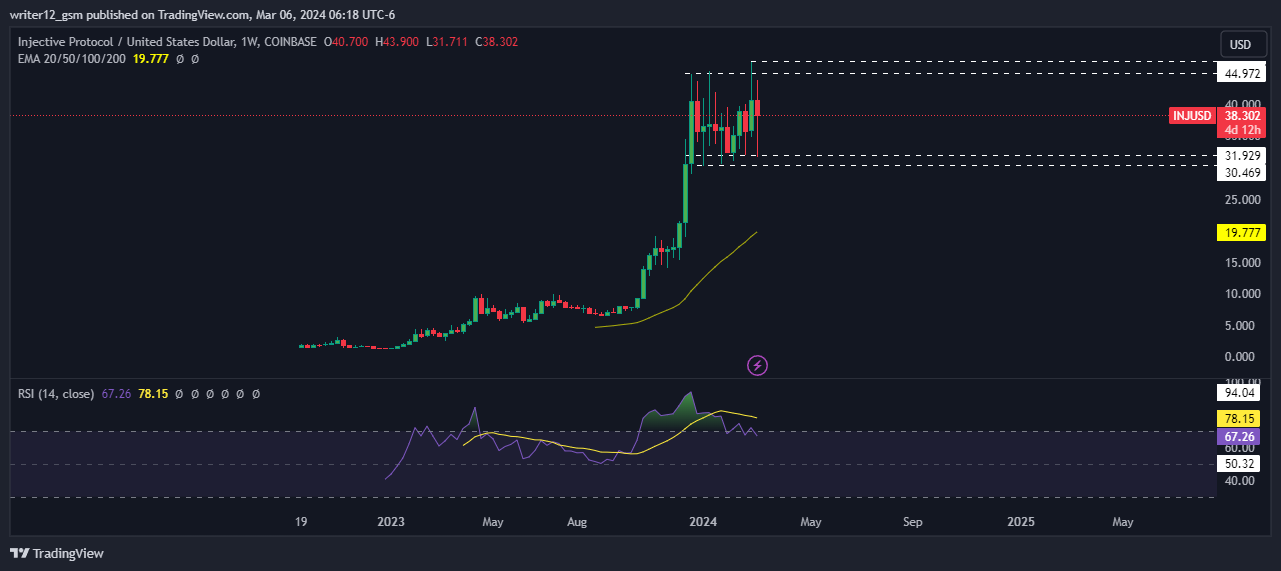
The weekly chart of the Injective Protocol crypto shows that the buyers are dominating. The cryptocurrency is currently in an uptrend as it has risen above the key EMAs.
Additionally, technical indicators support the bullish sentiment, as the RSI is approaching the overbought zone of 67, and the MACD has formed a bullish crossover with the green band. These signals suggest that the cryptocurrency may experience even greater upward pressure in the coming weeks.
Summary
Injective Protocol crypto’s daily chart reflects neutrality with several technical indicators confirming this neutral outlook. The RSI curve has been trading in the neutral region, reflecting neutrality in the trend. This indicates a neutral outlook for the upcoming trading sessions.
Technical Levels
Support Levels: $31.600 and $30.469.
Resistance Levels: $42.500 and $46.821.
Disclaimer
This article is for informational purposes only and provides no financial, investment, or other advice. The author or any people mentioned in this article are not responsible for any financial loss that may occur from investing in or trading. Please do your research before making any financial decisions
Anurag is working as a fundamental writer for The Coin Republic since 2021. He likes to exercise his curious muscles and research deep into a topic. Though he covers various aspects of the crypto industry, he is quite passionate about the Web3, NFTs, Gaming, and Metaverse, and envisions them as the future of the (digital) economy. A reader & writer at heart, he calls himself an “average guitar player” and a fun footballer.


