


The Polkadot (DOT) price has glimpsed an up move and replicated a breakout of the rounding bottom formation in the past sessions. Moreover, the DOT coin has gained momentum and exceeded the $10 mark, leading to sellers getting into trouble. However, the volatility rate was reduced from 0.050 to 0.034, which signifies that the bulls have settled the gains in the zone and may continue to extend.
The DOT price has transcended the neckline barrier of $10 and soared over 56% in the last 30 trading sessions. Furthermore, the coin has surpassed the key moving averages and has retained the bullish trajectory. DOT coin price has remarked a decent recovery from the lows of $4 and has picked strength. Per the Fib retracement levels, the coin has sustained gains above the 38.2% zone and is targeting to escape the $15 mark.
The Polkadot coin (DOT) price was $10.41 at press time, with an intraday gain of 3.81%, showing bullishness on the charts. Moreover, the trading volume has increased by 5.30% to $1.05 Billion. The DOT coin has a weekly return ratio of 24.78% and 54.50% on a monthly basis. The pair of DOT/BTC is at 0.000155 BTC, and the market cap is $14.43 Billion. Analysts are bullish and suggest that the DOT coin has picked strength and will continue outperforming in the following sessions.
Polkadot Exhibits Bull Accumulation; Can DOT Continue the Upmove?
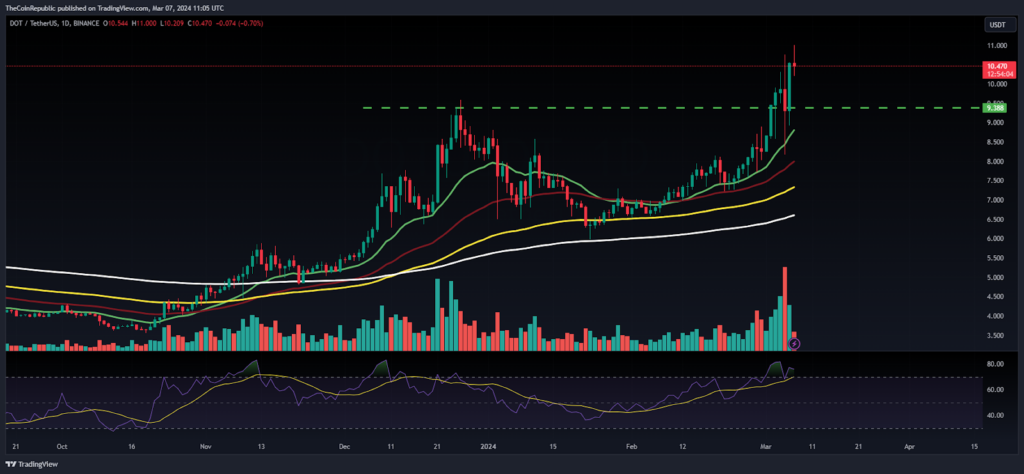
The Polkadot coin (DOT) price has persisted in forming higher high swings and is riding the bullish trend. Moreover, the coin has exhibited a positive crossover, which resembles the buyers’ dominance. As per the data from Coinglass, the open interest was noted at $330.10 Million, which signifies a short-coverage sentiment.
The Relative Strength Index (RSI) curve stayed in the overbought zone and depicted a negative crossover on the charts. However, the MACD indicator shows a bullish crossover and suggests a positive outlook for the upcoming sessions.
DOT Reveals Falling Channel Breakout on Weekly Charts
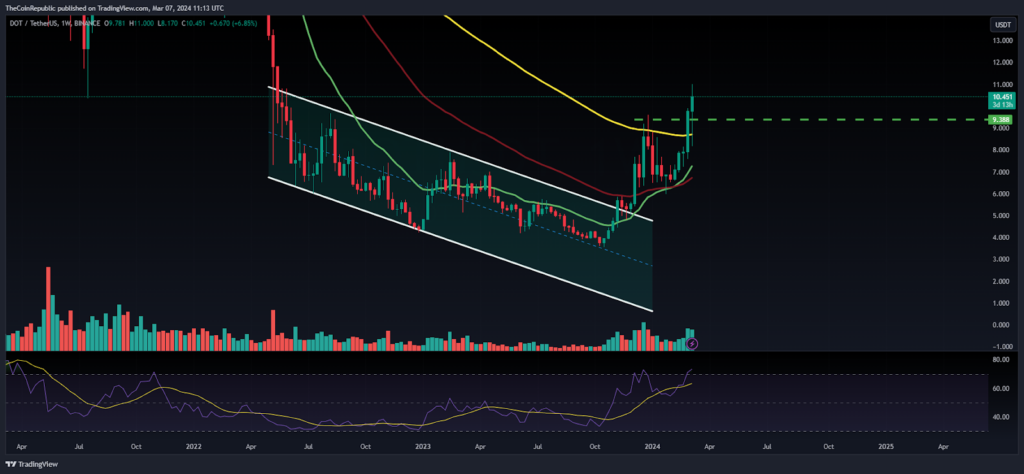
The DOT price was in a correction phase, and the demand zone of $4 was retested; a remarkable bounce was witnessed as a channel breakout. Afterward, the coin extended the rebound and recovered by over 180% in the last three months. The coin has surpassed the 100-day EMA hurdle and is ready to reach the blue sky zone above the $20 mark soon.
Summary
The Polkadot coin price has sustained gains above the $10 mark and is poised to outperform in the following sessions. The trend is intact, and further short-covering moves can be seen, which may soon lead the coin toward $15.
Technical Levels
Support Levels: $10 and $8
Resistance Levels: $12 and $15


