
 Home
Home News
News
- 1 The Flux coin price has risen and jumped above the $1 mark.
- 2 Bulls look aggressive and keen to extend the gains toward the $2 mark.
The Flux coin (FLUX) replicated a pullback from the 20-day EMA mark and soared above the $1 mark. The follow-on buying momentum was noted, and the coin persisted in delivering the higher high swings on the charts. Buyers are entering every dip, and a rising channel was noted on the charts.
At press time, the Flux coin (FLUX) price trades at $1.13 with an intraday gain of 8.79%, indicating bullishness on the charts. It has a monthly return ratio of 93.91% and 79.92% on a yearly basis, implying bullishness on the charts. The pair of FLUX/BTC is at 0.0000165 BTC, and the market cap is $387.52 Million. Analysts are neutral and suggest that the FLUX coin price will persist in lifting the gains and may catch the upside of the $2 mark soon.
Flux Price Action and Volume Analysis on Daily Charts
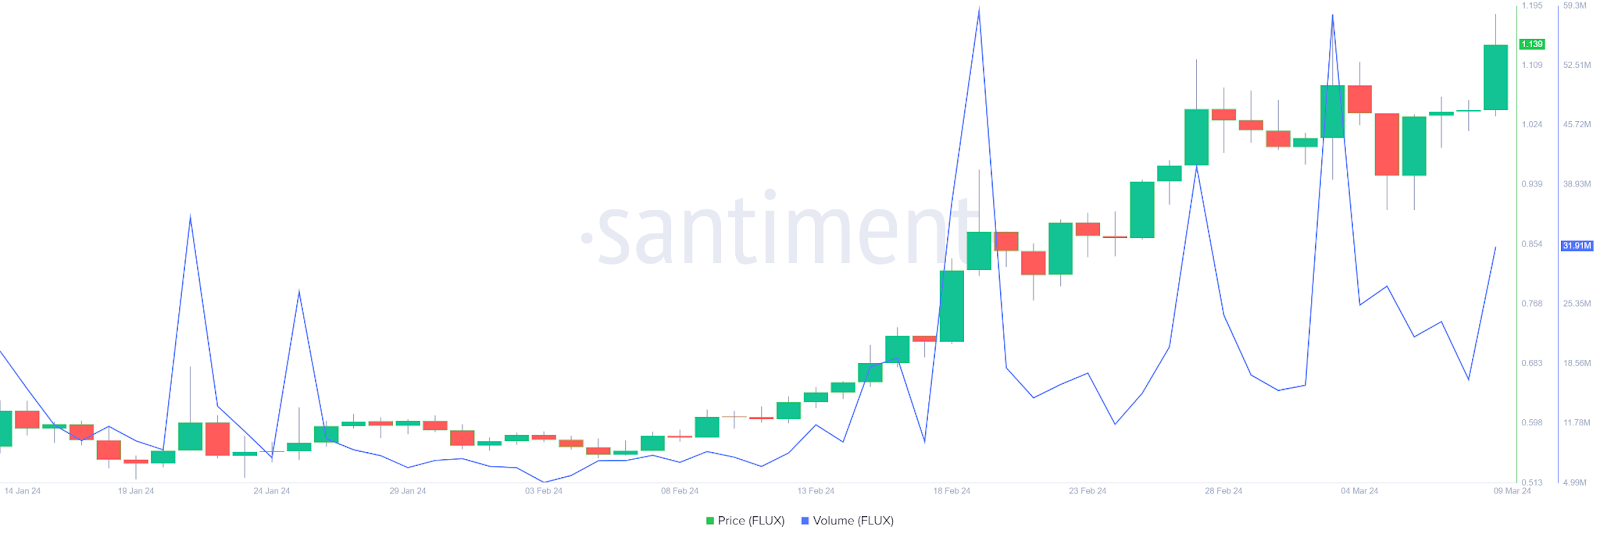
The Flux coin (FLUX) witnessed buying movements and has been rising since the start of 2024. The coin has attained a range breakout in the past weeks, and investors are paying attention, resulting in volume buying activity. The trading volume keeps fluctuating and increased by 100.53% to $32.90 Million in the last 24 hrs. Additionally, the average volume was noted at $38.01 Million.
The coin has a circulating supply of 343.03 Million and a total circulating supply of 440 Million, whereas the active addresses are at 828.
Price Volatility and Weighted Sentiment Overview
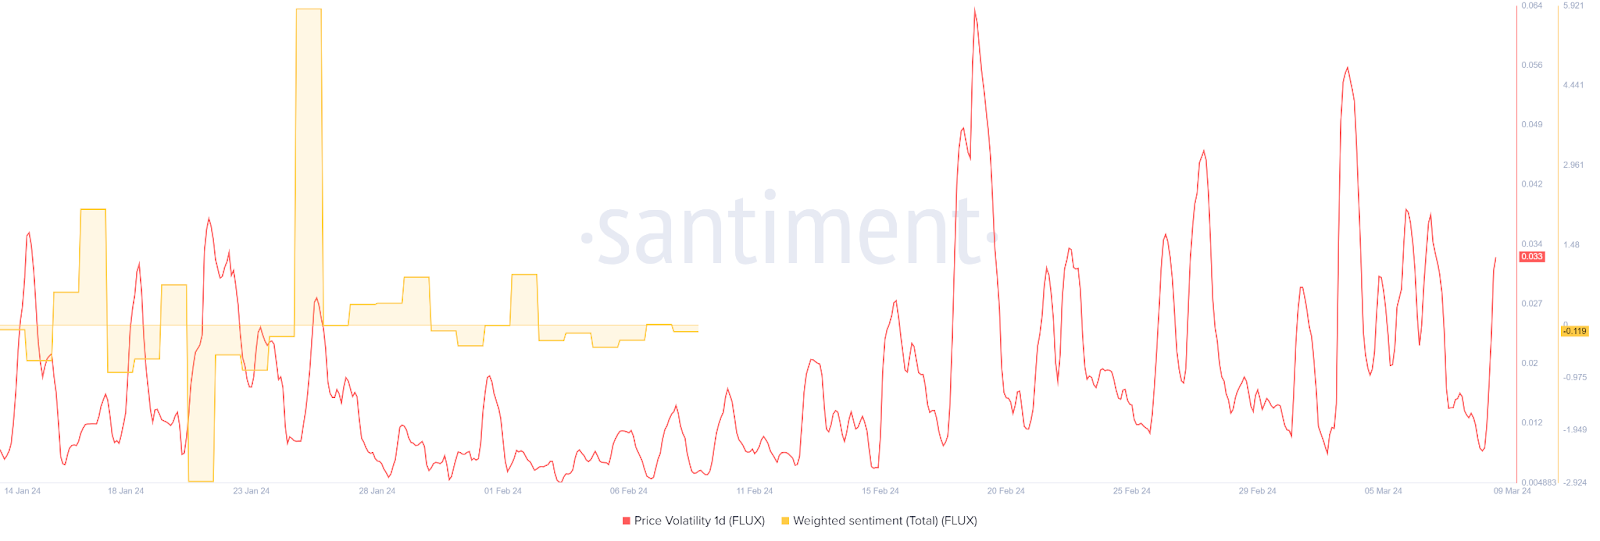
The Flux coin witnessed a massive surge in price volatility, and sharp fluctuations were noted this week. The volatility curve stands near 0.033; a rise of around 25% in the intraday season was recorded. However, the weighted sentiment analysis signifies a bearish outlook, and the curve stands near -0.019.
Flux Social Dominance and Development Activity
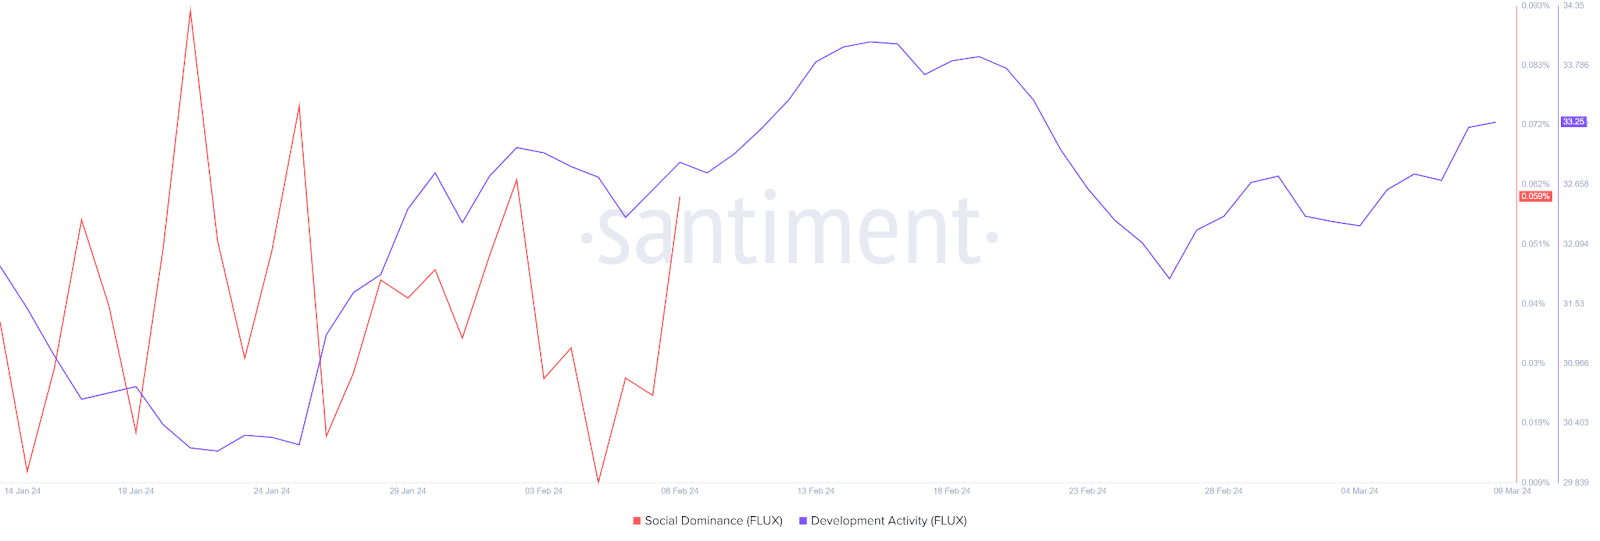
The social dominance of the coin signifies a sharp spike, which has soared over 50% to 0.059% in the past weeks. Moreover, the development activity of the con keeps rising and surged by 1.90% to 33.25. The overall data suggests a positive development and a favorable bullish outcome.
Flux Hints Bullishness: Can the Bulls Succeed in Crossing the $2 Mark?
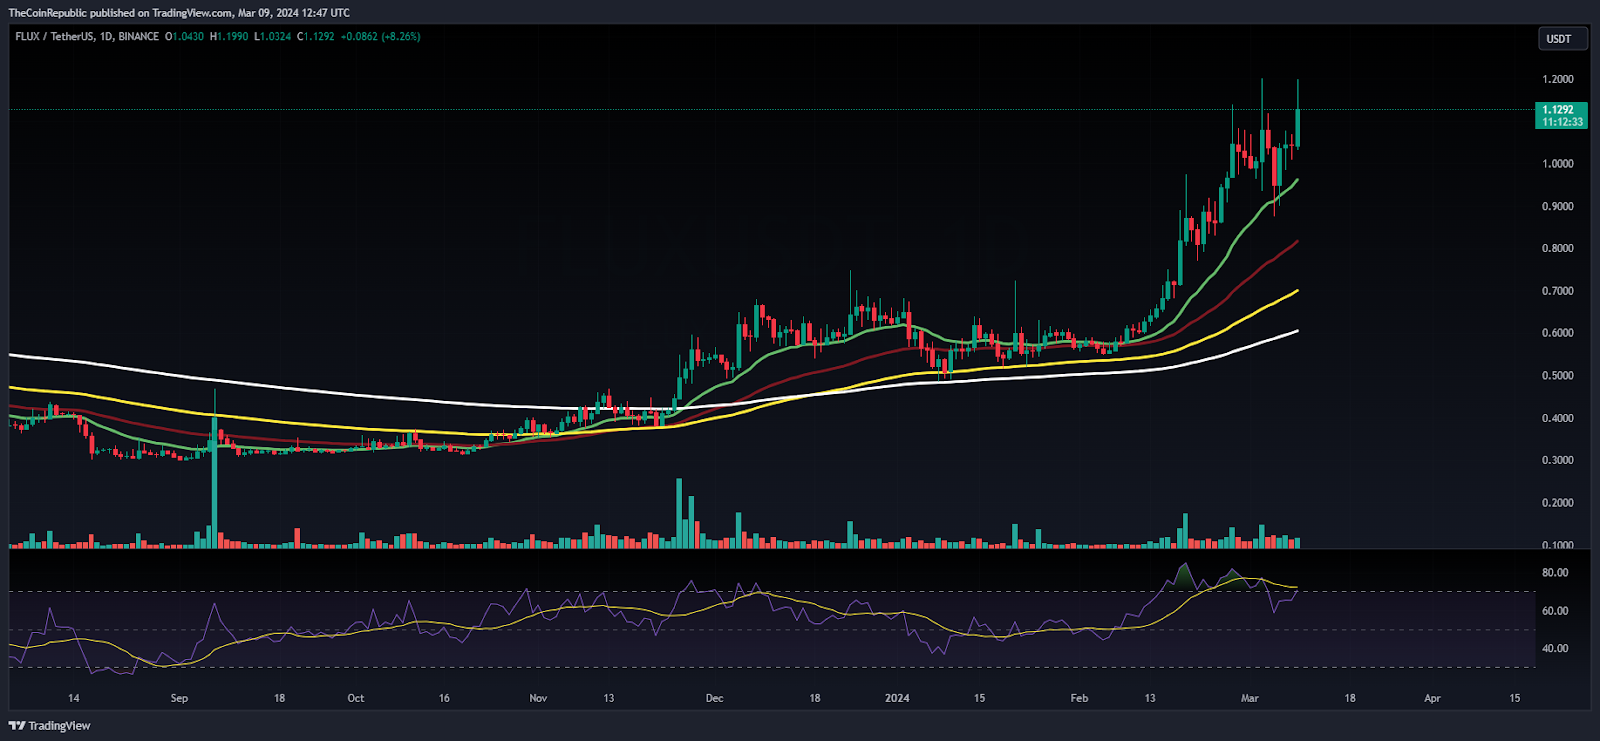
On the daily charts, the coin gained momentum and exceeded the $1 mark, signifying the bullish wave. Moreover, the coin has climbed above the significant moving averages and depicts the up move. The coin has witnessed a surge of over 30% this week, resembling the bulls’ dominance.
The Relative Strength Index (RSI) curve stays in the overbought zone and forms a positive crossover, implying bullish momentum. Similarly, the MACD indicator shows a bullish crossover and suggests an outperformance for the following sessions.
Summary
The Flux coin (FLUX) witnessed a bullish wave and persisted in soaring the gains, glimpsing a golden crossover on the charts. Moreover, the coin has exhibited a long buildup activity, and bulls intend to cross the upside hurdle of $1.50 to unlock the rally in the following sessions.
Technical Levels
Support Levels: $1.00 and $0.90
Resistance Levels: $1.40 and $1.60
Disclaimer
The views and opinions stated by the author or any other person named in this article are for informational purposes only and do not constitute financial, investment, or other advice.
Anurag is working as a fundamental writer for The Coin Republic since 2021. He likes to exercise his curious muscles and research deep into a topic. Though he covers various aspects of the crypto industry, he is quite passionate about the Web3, NFTs, Gaming, and Metaverse, and envisions them as the future of the (digital) economy. A reader & writer at heart, he calls himself an “average guitar player” and a fun footballer.


