
 Home
Home News
News

- 1 The Helium Crypto price is up by nearly 3.74% in Intraday and was trading close to 8.29 USD at the time of writing.
- 2 The HNT crypto took rebound from the 50-day EMA and has jumped higher, erasing the previous losses.
The Helium crypto gained traction on Saturday and has jumped off nearly 3.74% in the morning session. The bulls showed their strength once again near the 50-day EMA, and the price reversed its course after suffering rejection from the lower side.

The daily chart illustrates the formation of a descending triangle pattern near the highs. The bears are dominating near the trendline resistance and pushing the price down from the highs. On the other hand, the bulls have established themselves near previous breakout zones and prevented the price from falling lower.

Recently, the crypto price rebounded from the 50-day EMA and jumped higher. Yesterday, The bears attempted to break below the horizontal support of the descending triangle pattern. However, the bulls made a comeback in the evening session, and a pin bar candlestick was observed on the charts.
At the time of writing, Helium crypto was up nearly 3.74% on Saturday and was trading close to $8.29. The current circulating supply was 160.87 Million HNT tokens, and the maximum supply was 223 Million HNT tokens.
Helium Crypto Volume Analysis
Moreover, the Helium crypto volume analysis showcases that the crypto noted that the volume inflow was low in the last couple of weeks in January and the earlier two weeks of February. The average volume received at that time was $17.8 Million. The price maintained a correction phase in the period.
However, the HNT crypto experienced a significant surge in volume in February as the crypto broke out on the higher side. The average volume surged from $17.8 Million to $39 Million in March 2024.
The intraday volume received was $46 Million, dropping nearly 4.59% compared to the previous day. Also, the live market capitalization of HNT crypto was $1.32 Billion, ranking 85th in the overall crypto market.
Social Dominance and Social Volume Analysis
The social dominance and social volume chart displays the changes in awareness and the popularity of Helium crypto among users. Social media platforms like Twitter, Instagram, and Facebook act as a medium for the crypto to spread its reach and popularity among users.
The above data shows that the HNT crypto gained traction among users in December and January and witnessed a massive rise in popularity among social media users. However, Helium crypto seemed to lose its social dominance in February, which also negatively impacted the price and caused it to drop.
However, the recent data shows a rising curve in the Helium crypto social dominance and social volume in March 2024, which may have a positive impact on the price in the forthcoming sessions.
HNT Crypto: Open Interest Contracts Declined in Recent Sessions!
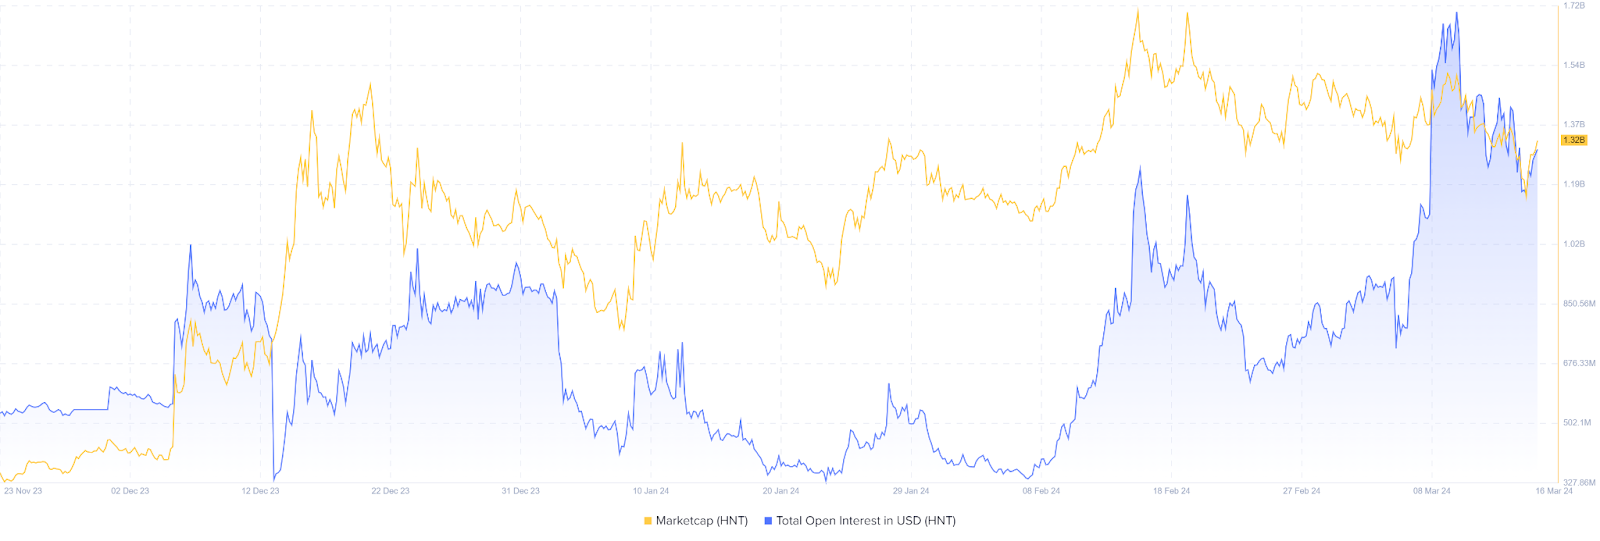
The OI data represents the Total number of open contracts in the Helium cryptocurrency. The above chart displays the price movement with respect to the Open Interest contracts. The OI data analysis saw a significant jump in the number of open contracts in February. The HNT price followed up the OI data and witnessed a surge in the last month.
However, the last couple of weeks saw a decline in the open contracts, which also dragged the price down. The number of open contracts decreased from 10.76 Million in February to 7.5 Million in March 2024.
Helium Crypto Price Prediction
The long-term trend outlook of HNT crypto is positive, which may attract more buying volume inflow at the dynamic support of the 50-day EMA. On the higher side, if the price breaks above the trendline resistance, it may resume towards the new swing high.
Our analysts’ most positive price prediction assumes the HNT cryptocurrency can attain a high of $11 as the highest price, suggesting an upside potential of 22%. On the lower side, the breakdown below the 50-day EMAs may indicate the continuation of the correction phase.
Conclusion
The Helium crypto took a rebound from the 50-day EMA and surged higher by 3.74% on Saturday. The bulls have established their presence near the 50-day EMA and intend to draw an upward trajectory in the forthcoming sessions.
On the higher side, a trendline resistance may act as a huddle for the buyers. Now, if the buyers can surpass it, the price may rise to a high of $11 and $13 as the higher targets for March 2024.
Technical levels:
- Support levels: $8.2 and $6.96
- Resistance levels: $11.04 and $12.84
Disclaimer
The views and opinions stated by the author, or any people named in this article, are for informational purposes only and do not establish financial, investment, or other advice. Investing in or trading crypto or stock comes with a risk of financial loss.

Andrew is a blockchain developer who developed his interest in cryptocurrencies while pursuing his post-graduation major in blockchain development. He is a keen observer of details and shares his passion for writing, along with coding. His backend knowledge about blockchain helps him give a unique perspective to his writing skills, and a reliable craft at explaining the concepts such as blockchain programming, languages and token minting. He also frequently shares technical details and performance indicators of ICOs and IDOs.


