
 Home
Home News
News
- 1 MANLET token price shows a reversal, reflecting bullish accumulation.
- 2 Technical indicators suggest the bullish waves are likely to continue.
The Manlet token is a token based on the Solana blockchain, it is operating on its major project known as Raydium. It has a total liquidity of $95,117.48 and the volume in the last 24 hours was noted at $270.72. In the last 24 hours, only 1 transaction has happened.
Raydium is an automated market maker (AMM) and a liquidity provider that interacts with Solana’s order book-based exchange, Serum. Its features include light-speed swaps, next-level liquidity, and frictionless yield farming on itself. Moreover, ifinity is known as the first proactive market maker on Solana. Its objective is to improve capital efficiency and reduce loss for liquidity providers.
Similarly, Orca is also one of the most user-friendly cryptocurrency exchanges on Solana. It offers token exchanges with minimal transaction fees and lower latency compared to Ethereum-based DEXs. Users can also provide liquidity to earn a share of trading fees.
At press time, the MANLET token price was trading at $0.000005578 with an intraday gain of 11.66%, reflecting neutrality on the charts. It has a monthly return ratio of 18.02% and 28.10% on a yearly basis. The pair of MANLET/SOL is at 0.00000000286 SOL. Analysts are neutral and suggest that MANLET price will continue to deliver bullish waves and will cross the prompt mark of $0.000006000 soon.
MANLET Technical Analysis On Daily Timeframe
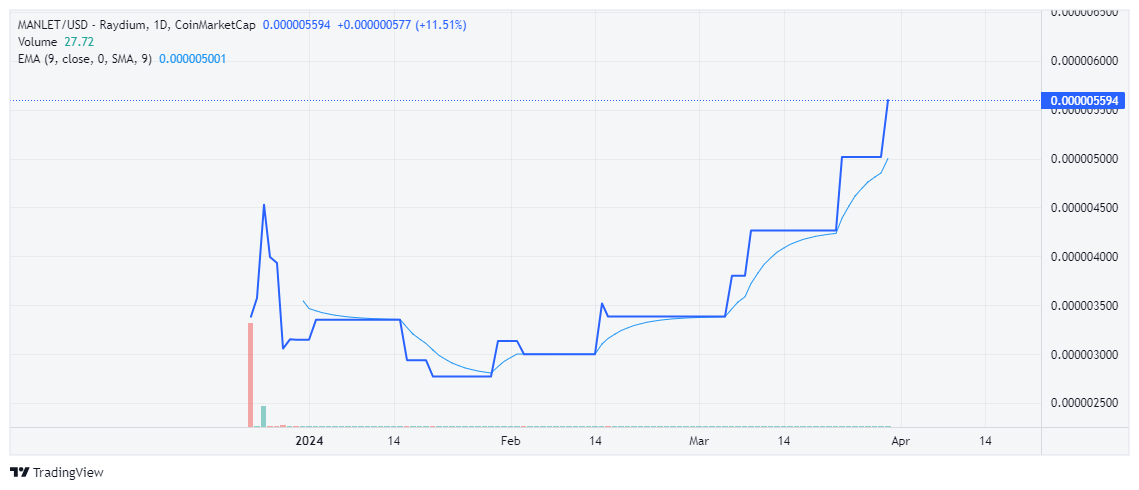
The daily charts showcased the MANLET token has delivered higher high swings and has stepped up the gains in the past sessions. Furthermore, the price action is delivering the buyer accumulation and the token is intending to cross the round mark of $0.000006000. The higher high structure was noted on the charts and buyers are showcasing their strength. The MANLET token has an all time high mark of $0.000008500.
Per the Fibonacci retracement levels, the token has sustained above the 50% zone and is heading toward the 61.8% zone. However, the token needs to sustain above the barrier of $0.00005500 to continue the up move.
The RSI curve stayed in the overbought zone and formed a positive crossover suggesting bullish momentum for the upcoming sessions. Moreover, the MACD indicator shows a bullish crossover and suggests outperformance for the next few sessions.
Summary
The MANLET token price chart shows a bounce and higher high swings. Moreover, the trend is intact and the token will continue to expand the rise and may even retest the upside of $0.000006000 soon.
Technical Levels
Support Levels: $0.000005100 and $0.000005300
Resistance Levels: $0.000005800 and $0.000006000
Disclaimer
In this article, the views, and opinions stated by the author, or any people named are for informational purposes only, and they don’t establish the investment, financial, or any other advice. Trading or investing in cryptocurrency assets comes with a risk of financial loss.

Steefan George is a crypto and blockchain enthusiast, with a remarkable grasp on market and technology. Having a graduate degree in computer science and an MBA in BFSI, he is an excellent technology writer at The Coin Republic. He is passionate about getting a billion of the human population onto Web3. His principle is to write like “explaining to a 6-year old”, so that a layman can learn the potential of, and get benefitted from this revolutionary technology.


