
 Home
Home News
News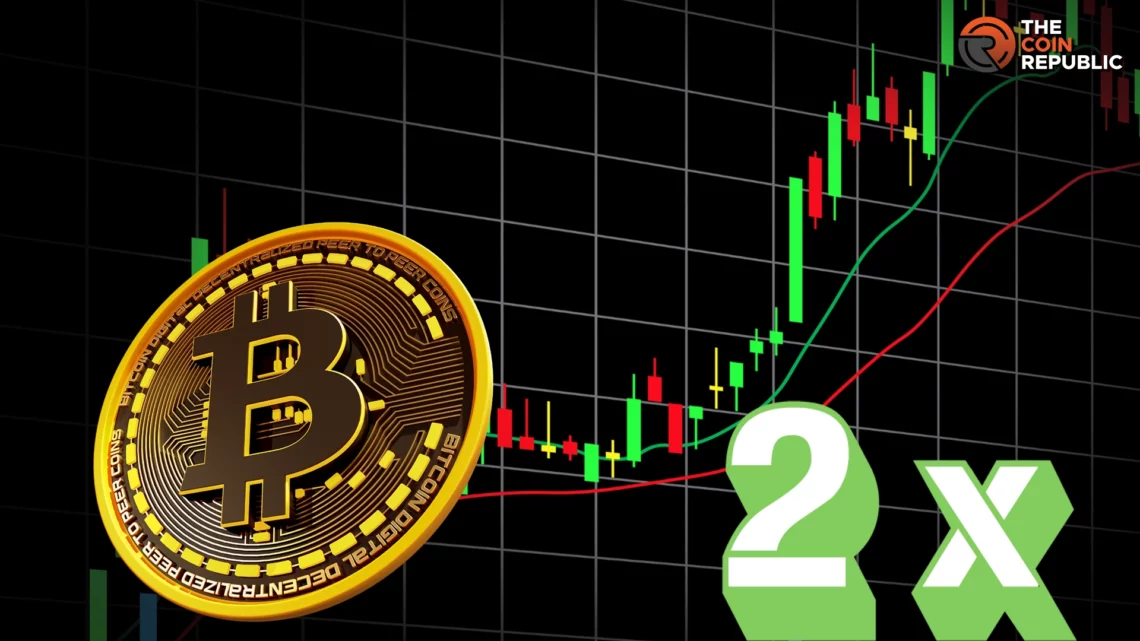
Analysts on X have shown historical trends with the Bollinger Bands indicator which predicted a near 100% increase in the price of Bitcoin.
An analyst has claimed that BTC price could double up within three months, using a widely-used momentum indicator. The upper Bollinger Band has been crossed by Bitcoin for two consecutive months, and in the past, every time Bitcoin has done this, its price has doubled within the next three months.
Bitcoin For Another 100%
If the prediction goes well, this could mean that Bitcoin’s price may reach up to $140,000 by July. The current optimism among investors may be due to the expected supply cut due to the halving event.
In the last 24 hours, total liquidations have surpassed $108 Million, as shown by the CoinGlass report. The rising open interest level and hash rate growth suggest that the commodity market will improve, creating a profitable timeframe for mining.
#BITCOIN TO $85,000 BEFORE HALVING
— That Martini Guy (@MartiniGuyYT) March 25, 2024
According to Martini Guy, a self-proclaimed crypto pundit on X, Bitcoin will reach $85,000 before the next halving, which is expected to take place in April. To achieve this, Bitcoin’s price needs to increase by at least 21% before April 15th. However, this is the approximate date of the halving.
Bollinger Bands are a tool used in technical analysis to measure the momentum and volatility of an asset within a certain range. Touching the upper band can indicate an overbought signal, while touching the lower band indicates that an asset is oversold.
Bollinger Bands Are Reactive
Bollinger Bands are not the only technical indicator available to analysts. Bollinger Bands are more reactive than predictive. Moreover, given their use of past price action and volatility, data is also not considered reliable by many traders. The metrics can also differ widely during peak bull and bear markets.
Anthony Scaramucci predicts that Bitcoin could reach $170,000 during the cycle. He eventually eventually traded at around half the total value of the global gold market. This would result in a price of approximately $400,000 per BTC.
Scaramucci described the ten recently approved spot Bitcoin ETFs as “selling machines,” arguing that these products would only continue to spur increased retail and institution.
However, this figure highlights the volatile nature of the market, with significant sums shuffled as traders position themselves ahead of expected fluctuations.
Spot Bitcoin ETFs Over $12B
The spot Bitcoin ETFs have now seen over $12 billion worth of net inflows into the ten products, excluding Grayscale. When the Gold ETF (GLD) was launched in November 2004, it took nearly one year to notch $10 billion in inflows.
Ripple CEO Brad Garlinghouse predicts that the crypto sector will be worth $5 Trillion by year-end. He also added the upcoming halving context, regulatory developments, and Bitcoin ETFs as factors contributing to wider crypto adoption. According to Garlinghouse, the macro trends, such as the ETFs, are driving real institutional money for the first time.
Summary
An analyst used a momentum indicator, the Bollinger Bands to predict that Bitcoin’s price may double within three months. However, it is important to note that Bollinger Bands are not the only technical indicator available to analysts and are more reactive than predictive.
Disclaimer
The views and opinions stated by the author or any people named in this article are for informational purposes only. They do not establish financial, investment, or other advice. Investing in or trading in stocks, cryptos, or other related indexes comes with a risk of monetary loss.

Adarsh Singh is a true connoisseur of Defi and Blockchain technologies, who left his job at a “Big 4” multinational finance firm to pursue crypto and NFT trading full-time. He has a strong background in finance, with MBA from a prestigious B-school. He delves deep into these innovative fields, unraveling their intricacies. Uncovering hidden gems, be it coins, tokens or NFTs, is his expertise. NFTs drive deep interest for him, and his creative analysis of NFTs opens up engaging narratives. He strives to bring decentralized digital assets accessible to the masses.


