
 Home
Home News
News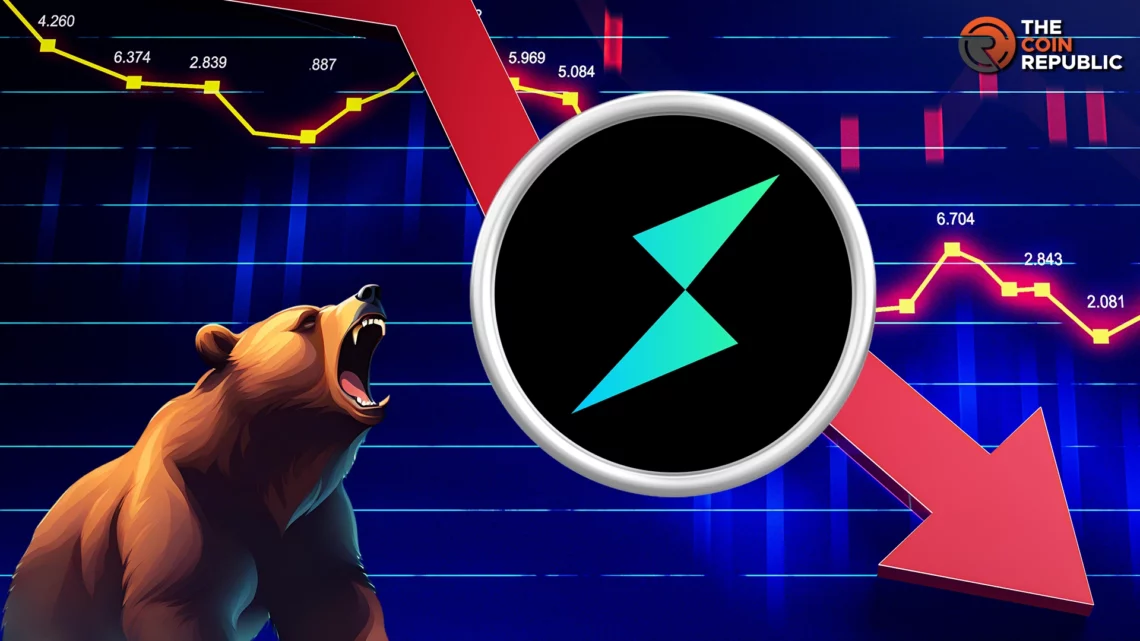
- 1 The RUNE price signifies selling pressure and hovers around the 200-day EMA mark.
- 2 Buyers have lost strength and are attempting to retain the $6 mark.
The RUNE coin price signifies a follow-on selling momentum, and it has retested its support zone of $5 in the last sessions. However, the bulls found support there and held the 200-day EMA mark. Amidst the selling pressure, the coin price is still trading above the neutral region and is looking for a significant pullback. The price action replicates the sellers’ dominance and willingness to breach the $5 mark shortly.
At press time, the Thorchain coin (RUNE) price traded at $5.26 with an intraday drop of 5.56%, reflecting neutrality on the charts. It has a monthly return ratio of -49.37% and 208.78% on a yearly basis. The pair of RUNE/BTC is at 0.0000814 BTC, and the market cap is $1.58 Billion. Analysts are neutral and suggest that the RUNE coin may hold the 200-day EMA and will replicate a bounce soon.
RUNE Price-to-Volume Profile On Daily Timeframe
The above chart showcased the price-to-volume profile of the Thorchain coin (RUNE), which signifies profit booking and buyers losing their grip, resulting in selloffs in the past sessions. Moreover, the coin has retraced to the 200-day EMA mark and is glimpsing seller dominance on the charts. The intraday trading volume spiked over 42.89% to $1.58 billion, which was a sign of investor interest.
Price Volatility and Sentiment Analysis
Followed by the noteworthy selloff of over 51%, the price volatility curve witnessed a spike of over 12% to 0.069, witnessing massive investor speculations. Additionally, the weighted sentiment remained close to the midline, at around -0.0071.
Social Dominance and Social Volume AI Overview
The Social Dominance noted a decline over 31.90% to 0.131%, replicating a decrease in the discussion reports on media platforms this week. Similarly, the social volume AI value witnessed no significant surge and stayed around 2.
Development Activity and Contributors Count Outlook
Per the charts, the development data witnessed average movement and stayed below the midline around 0.19, glimpsing a neutral outlook. Furthermore, the contributor count also remained average, at around 1.
Per the Fib levels, the RUNE price has retested the 23.6% zone, delivering a negative outlook. Likewise, the RSI curve stayed below the midline, and a rebound was noted from the oversold region, noted near 32.
The total supply of the RUNE coin is 500 Million, whereas the volume-to-market cap ratio is 0.564, and it ranked 57 in terms of market cap in the global crypto market.
Summary
The RUNE coin price signifies bearish momentum, and trades below the significant moving averages replicate a negative outlook. Additionally, the coin is on the verge of the crucial support zone of $5 and may undergo a selloff ahead.
Technical Levels
Support Levels: $5 and $4.70
Resistance Levels: $5.80 and $6.30
Disclaimer
The views and opinions stated by the author or any other person named in this article are for informational purposes only and do not constitute financial, investment, or other advice

Andrew is a blockchain developer who developed his interest in cryptocurrencies while pursuing his post-graduation major in blockchain development. He is a keen observer of details and shares his passion for writing, along with coding. His backend knowledge about blockchain helps him give a unique perspective to his writing skills, and a reliable craft at explaining the concepts such as blockchain programming, languages and token minting. He also frequently shares technical details and performance indicators of ICOs and IDOs.


