
 Home
Home News
News
- 1 Render (RNDR) shows buying pressure this week and is set for a surge.
- 2 Technical indicators suggest an outperform outlook ahead.
The Render (RNDR) token price noticed a gigantic upmove and noted sharp pump activity this week. The Render (RNDR) token decisively carried the gains despite the volatile market.
Moreover, the RNDR token is on the way to retest the 52-week high mark around $13. Following the bull accumulation, the downward trendline was breached, and a reversal was made.
Since the start of May, fresh new delights have been seen, and follow-on buying momentum was witnessed, leading to a jump of over 45% this week. The Render (RNDR) token finally found the bullish path and is eyeing to cross the $13 mark.
At press time, the Render token (RNDR) price traded at $10.10 with an intraday drop of 1.10%, reflecting neutrality on the charts. It has a monthly return ratio of 3.90% and 444.56% yearly.
The pair of RNDR/BTC is at 0.000162 BTC, and the market cap is $5.40 Billion. Analysts are bullish and suggest that the Render price may stretch the up move and will skyrocket the gains in the following sessions
Is Render (RNDR) Set For a Sharp Surge: Price Action Outlook
The Render (RNDR) token’s daily charts highlight notable buying activity with a significant spike in trading volume. The intraday volume surged over 14.46% to $746.22 million, and the long/short ratio was 0.9743.
Source: Twitter
Recently, the token has escaped the downward trendline mark of $8 and a sharp uptick was noted. Apart from that, the price action delivers bullish insights and the token is ready for a sharp surge in the upcoming sessions.
Key Indicators Delivering Bullish Delights
1. Sharpe Ratio
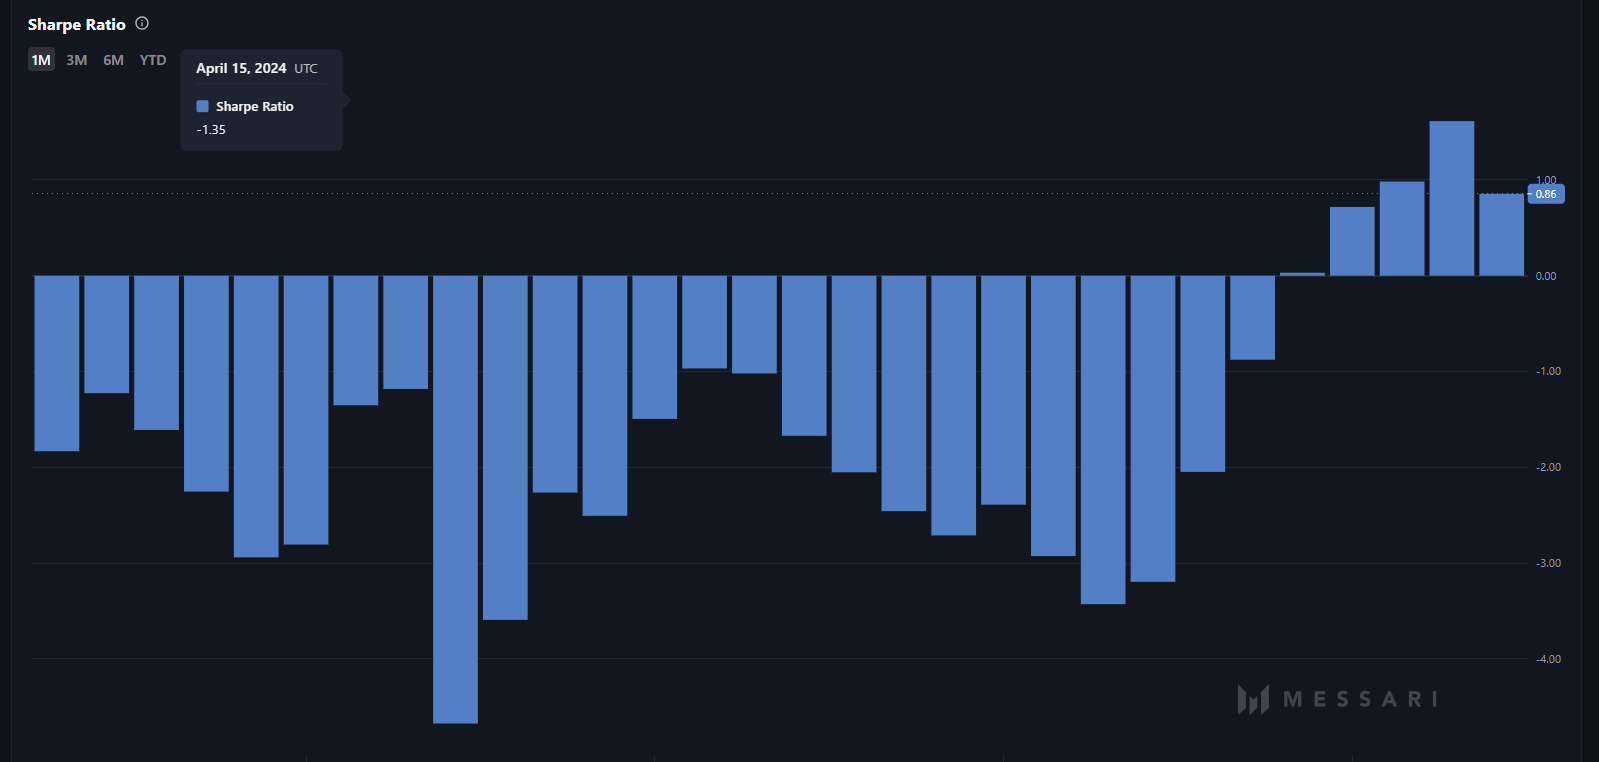
The above data shows that the value of the Sharpe ratio was significantly increased and reached the 1 mark. Notably, the value of 1 signifies a good number.
2. Historical In/Out Of the Money
Per the above data, more than 81% of in-the-money holders at the current price levels are in profit, whereas around 10.78% are looking to secure the supply mark of $13.
3. Futures Open Interest
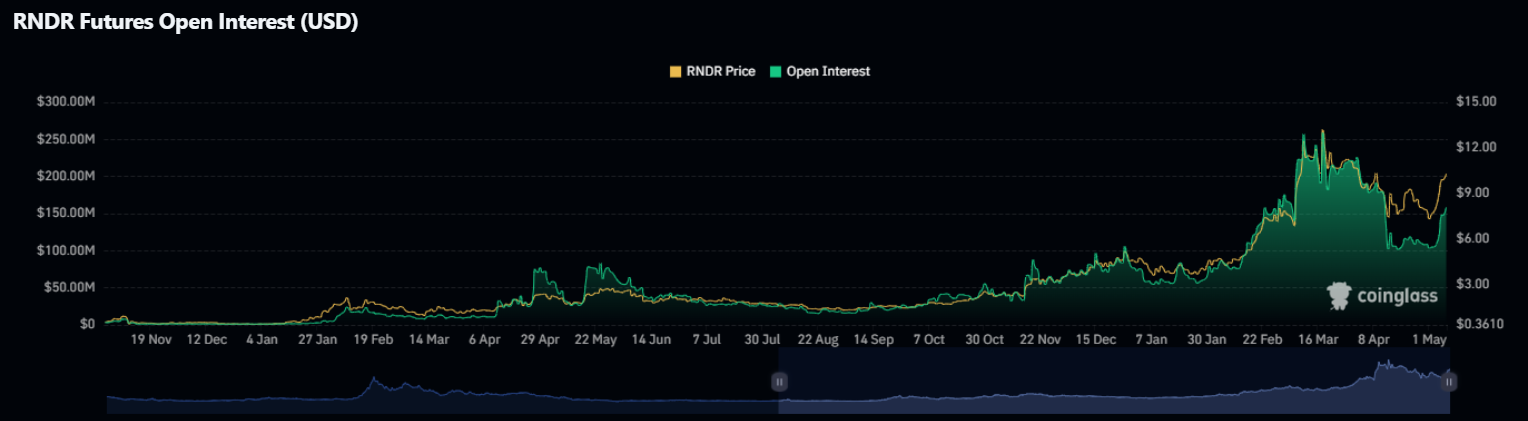
Meanwhile, short covering was triggered in the past 24 hrs, and a significant price surge was noted. The open interest dropped over 9.89%, noting at $156.14 million.
Whales Activity Favours Buying Pressure
Per the data from the Lookonchain on the X platform, the recent transaction data signifies that users have withdrawn their holdings from Exchange to their wallet, which is the primary reason for the upmove this week.
2/ 0x15CF withdrew 748,898 $RNDR($5.3M) from #Binance on Apr 30 and May 1, with a current floating profit of $2.24M.
— Lookonchain (@lookonchain) May 8, 2024
He had traded $RNDR 7 times before, 6 of which were profitable, with a win rate of 85.7% and a total profit of $3.5M!https://t.co/Uzwjdhtspy pic.twitter.com/TnMT1D2OuS
Source: Twitter (X)
The immediate support levels for the Render token (RNDR) are $9.80 and $9.20, whereas the key upside hurdle is around $10.70, followed by $11.

Conclusion
The Render (RNDR) price trades have a bullish bias, and bullish momentum has been witnessed in the last sessions. Moreover, the price action hints at the bull accumulation and denotes the short-covering activity.
Disclaimer
The views and opinions stated by the author or any other person named in this article are for informational purposes only and do not constitute financial, investment, or other advice.
Anurag is working as a fundamental writer for The Coin Republic since 2021. He likes to exercise his curious muscles and research deep into a topic. Though he covers various aspects of the crypto industry, he is quite passionate about the Web3, NFTs, Gaming, and Metaverse, and envisions them as the future of the (digital) economy. A reader & writer at heart, he calls himself an “average guitar player” and a fun footballer.


