


Recently, in the last five days, the BTC has been trying to sustain after dipping beneath $55000, and SUI was trying to sustain near the $0.60 support level.
The SUI has resonated with BTC price activity, and fell majorly. At press time, the price was $0.6873 post a 2.09% intraday gain.
According to the TradingView daily chart (SUI/USD: COINBASE), the highest price was $2.18, recorded on March 27th, 2024. Comparatively, the price at press time was 65% lower than the all-time high price.
Likewise, the lowest price of SUI was $0.3691, which was recorded on October 20th, 2023. Comparatively, the current price is nearly 85% higher than its all-time low price.
Decoding From Total Value Locked Data on SUI!
The SUI network had displayed that the TVL was at its peak at $780.31 Million around May 2024 but began to slump afterwards, similar to BTC’s TVL. The decline in TVL shows that the demand for SUI projects is on the decline, and consumers’ willingness to stay invested is also has plummeted.
TVL Of SUI | Source: DefillamaTVL stands at $530.21 Million, displaying a slight surge. SUI’s sustenance last week by the bulls indicate a recovery sign. If the graph forms seamless lower lows and highs, the TVL could plunge, and the price could simultaneously decline.
What do Derivatives Highlight in SUI?
At the time of writing, SUI’s derivatives volume stands at $209.67 Million, which has seen a growth of 27.96%.
Moreover, the Open Interest has witnessed a lot of declines in the SUI’s futures and derivatives contracts, which used to be around $290 Million worth of OI running in the market by March 28th, 2024. The OI, as of press time, stands around $59.69 Million, reflecting a 6.13% growth from the last session.

Lastly, the Liquidation data shows that in June 2024, major longs were liquidated, and the bearishness has been evident on the price chart. Short liquidations have also shown growth.

Meanwhile, the long/short ratio stands at 1.0044, which highlights that in the past 24 hours of trading activity, more shorts had been liquidated against longs. Thus, it meant that the sustenance seems due to higher shorts of $326.81K against longs of $63.10K.
SUI Technical Analysis
Sui surged, rallying over 500% from $0.35 on October 20th, 2023, to $2.18 by March 27th, 2024. However, it failed to sustain. It lost nearly 50% of the gains over the next 15 days.
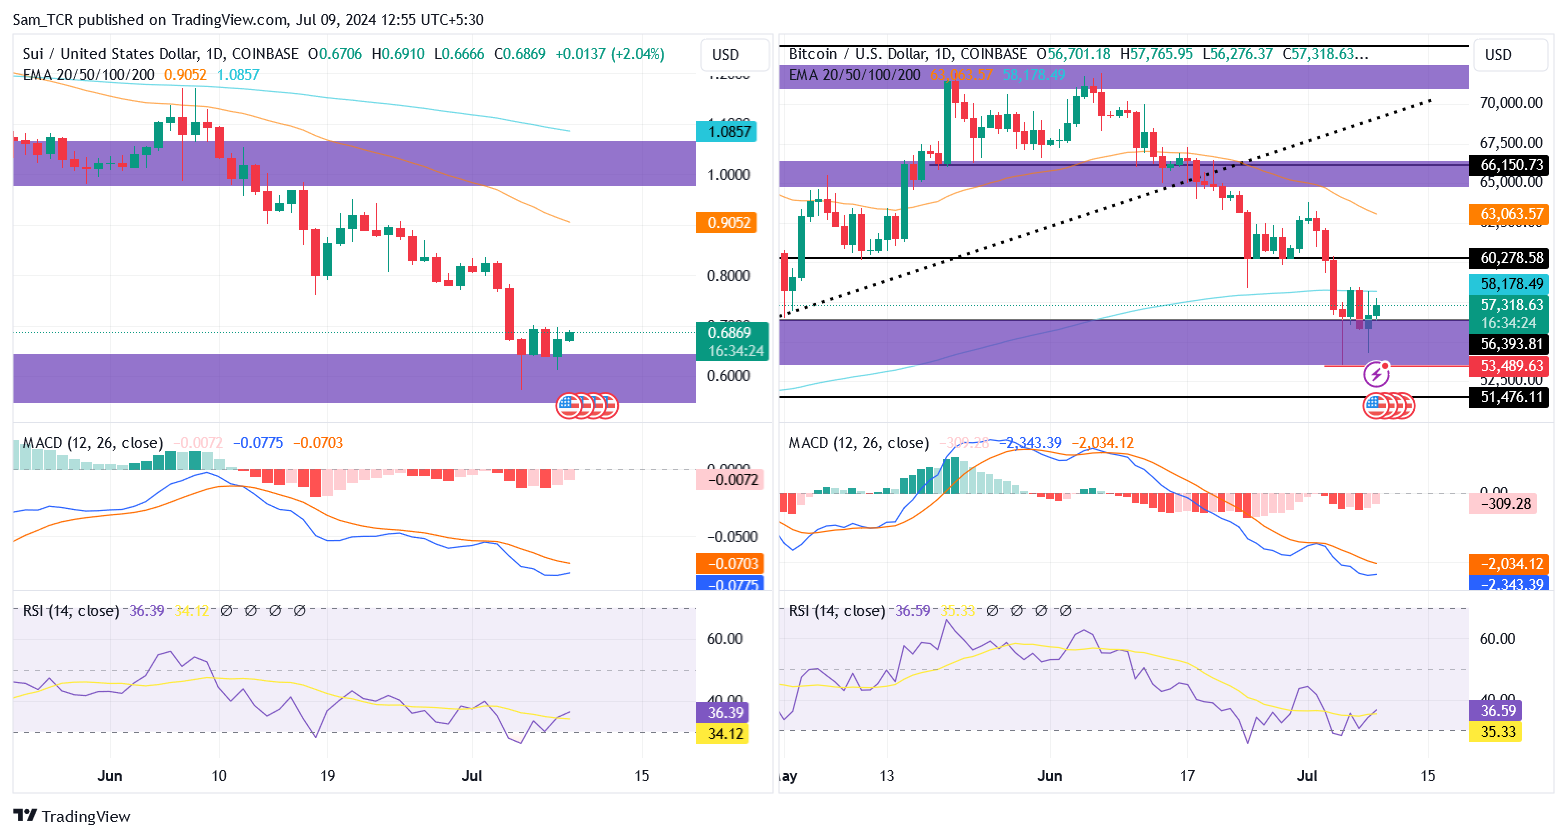
Thereon, the price tried seamlessly to hold on to the $0.910 level but failed after June 15th, 2024, as BTC slipped from its $65000 support. Now, the price is sustaining at $0.60, where an earlier rally popped out.
Looking at the indicators, they show nothing much that has not already been on the price chart. For the MACD below zero line, dynamic resistances of EMA pushed the price down, with RSI at 36.58, signifying the bull’s presence.
Therefore, looking at the broader picture, if the movement around $0.60 attracts bulls, the nearest resistance would be at $0.91, and $1.38, respectively.
However, if SUI loses traction on the $0.60 price level, the deterioration could stretch toward the $0.36 level.
Sui (SUI) has been trying to hold above the $0.60 support level after a recent drop. The price surged earlier this year but failed to sustain. Bulls are trying to regain control, but if SUI loses traction at $0.60, it could fall to $0.36.


