Fantom was one of the better-performing crypto assets in the last 24 hours, with double-digit gains. Although it succeeded in registering a recovery from the bottom, it is still in the downward region.
Following the price recovery, the blockchain network activity was also due to the several advancements in the ecosystem last week.
Meanwhile, the token was traded in a bearish trend, and the decline continued over the past few months. Notably, it has fallen toward its 52-week lower trajectory support zone around $0.3500, and bulls have tried to defend the gains there.
Undoubtedly, the short-term trend was still in favor of the bear cartel, while on every dip, bounces were also there. Once the Fantom price recaptures the $0.6000, it will regain strength and recover ahead.
On the contrary, further downside could be seen if sellers succeed in pushing FTM price below the $0.3500 mark.
Is Fantom’s Recovery Imminent?
During the week, bears were still in control of the overall market, while Fantom Bulls decided to do the opposite, as its daily and weekly charts displayed a recovery and offered some greens.
At press time, the FTM price was trading at $0.479 with an intraday surge of 9.36%, reflecting a recovery on the chart. It has a monthly return ratio of -30.20% and 70.20% yearly, reflecting short-term weakness.
The pair of FTM/BTC is at 0.00000816 BTC, and the market cap is $862.79 Million. When writing, analysts were neutral and suggested that the FTM price may register a range breakout and retain the mark of $3.
The daily charts showed that the FTM price had defended the support zone of $0.3500 and initiated a bounce from the bottom. Fueled by the buyer accumulation, the token was trying to stretch the pullback toward its 20-day EMA mark at press time.
Notably, the RSI curve displayed a positive divergence, indicating an imminent potential recovery. Similarly, the MACD indicator highlighted the bullish crossover on the chart.
@Muneeb, in his Tweet said:
$FTM
— 𝑀𝓊𝓃𝑒𝑒𝒷 (@MirMuneeb55) July 9, 2024
I am Accumulating, are u? pic.twitter.com/7XMfy1iJJS
Development Activity Showed A Surge
One of the most important metrics, development activity, indicated that the developers persisted in launching the new features, which might fuel the price recovery ahead.
It continued to sprint and reached the blue sky zone around 96, conveying a positive outlook.
Its contributors count persisted in putting efforts, showing a rise of over 13% to 54. Similarly, the number of holders kept rising and surged to 114k.
Network Growth and Active Addresses Showed a Dip
Per the Santiment data, the network growth data witnessed a dip, highlighting that new addresses have lost interest in the token.
Similarly, the active addresses data witnessed flat movements and conveyed mixed cues, and neither the bulls nor the bears maintained their upper hand.
The notable spike in velocity value indicated the increase in transfers at the time of writing. It means there is a high increase in activity involving Fantom.
Total Value Locked Revealed a Slight Dip
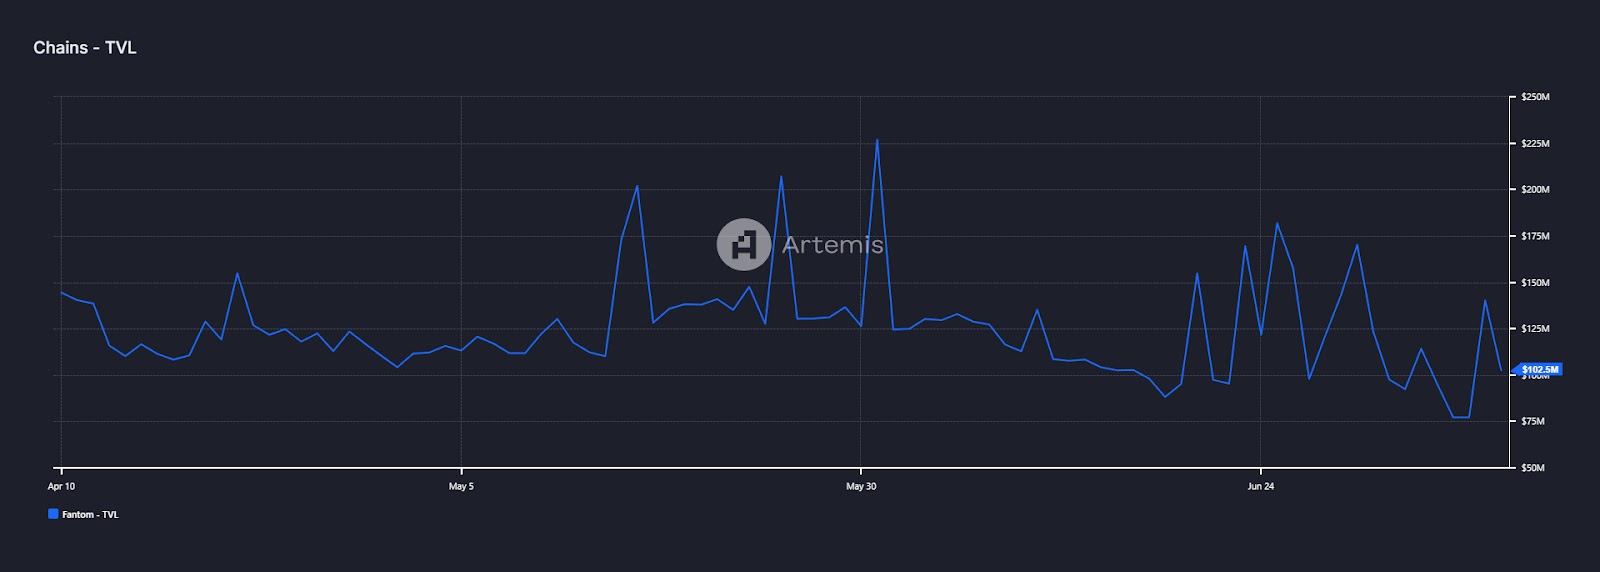
The recent decline in the TVL data signifies that market participants were cautious about adding liquidity to the token.
As of now, the TVL of the token was noted at $102.5 million, a dip of over 8% in the last 24 hours.
If the downward trendline hurdle was not breached, the token could continue trading in the downtrend.
The immediate support levels for the Fantom token at press time were $1.80 and $1.30, whereas the key upside hurdle was around $2.40, followed by $3
Is Fantom a Safe Buy on Dip Opportunity Now?
The Fantom token price witnessed a steady recovery, and the bulls attained consecutive gains this week. Amidst the bearish sentiment across the market, the token revived from the bottom and anticipated a recovery ahead.