The global market cap seems considerably large, per CoinMarketCap. It stands at $2.11 Trillion, with a massive global 24-hour volume amounting to $68.64 Billion.
Market dominance of BTC stands at 53.4%, for ETH, the figure is 17.5%. July 5th onwards, BTC sustained post a price decline, majority of the crytpos followed suit. Thus, the overall crypto verse sentiment looks bullish and optimistic.
Could the Biggest Underperformer Render (RNDR) be an Ace Pick?
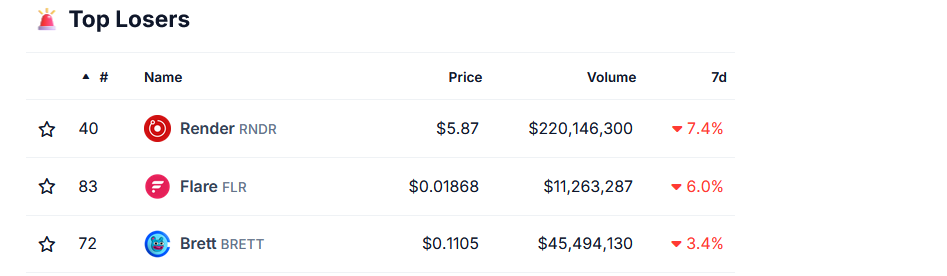
RNDR, the leading facilitator of decentralized rendering solutions, has been number 1 on the underperformer’s list due to the higher market sentiment defiance. With the bearish sentiment, it produced a weekly loss of nearly 7.4% and topped the list.
The picture shows the flip possibility, apart from the breakdown of the symmetrical triangle, looking at its chart, as the breakdown could end near the $5 exclusive support. $5 could act as significant support.
So it looks like it can ace from the list and turn from underperformer to outperformer, but it has a cache that totally depends on the buyer’s will and interest.
At press, it trades near $5.827 and looks like it’s getting pushed downwards from the dynamic EMA bands of 50-day and 200-day EMA. Meanwhile, the MACD supports further bearishness, and RSI is inching towards a further oversold vicinity.
Overall, the graphs display bearishness and an opportunity that could pop out from $5 support (DYOR).
Does FLR Have the Capacity to Turn Bullish?
FLR has been seamlessly inching towards the deciding support level of around $0.01600. It is further pushed by the dynamic trendline resistance and dynamic bands of 50 and 200-day EMAs, acting as a barrier.
But there is a slim chance of bulls making a reversal, which could be from the support of $0.01600 because the RSI has reached the oversold zone (30) and breached extreme oversold territory.
The RSI reaching between the 25-20 oversold conditions would take the price to land at $0.01600. Thus, a solid technical intuition from here lies that a significant parabolic movement could pop out based on buyers’ intent.
So buyers must wait before entering any trades and should do intense research (DYOR).
A memecoin on Base Chain- BRETT, Can it Resurface?
The BRETT, a meme-coin, has displayed degradation on the symmetrical triangle breakdown chart. The profit booking continues after trying to hold the gains when it surged 550% in the past from bottom to peak at $0.19415.
In this memecoin, the investors and traders are not finding an optimum level to step in for going long in BRETT, so the deterioration could continue until it finds one.
Per the technical price action, the best interruption for bears that could stand tall could be the $0.07050 critical support level. This support level could act as a support turned out from resistance.
Meanwhile, on the support of $0.07050, the buyers could step in prominently and find the level attractive, but the cache is the buyer’s interest.
On the flip side, breaching this could even harm the price if buyers don’t want to bet on BRETT from the chosen support. So, investors and traders should stay cautious before going long in any financial-related scrips and cryptos (DYOR).