


 At Demand Zone: Pullback On The Horizon?")

Hovering near its most vital support zone ($20), AR underperformed in the past few months.
Since March, the token has attempted multiple times to breach the supply zone of $48-50, but sellers were resilient.
Interestingly, the same happened at the bottom with the sellers, they also had tried to breach the demand zone of $20. These roller coaster moves led to the token staying in a closed range over the past few months.
As of now, the token is below the significant moving averages amid a lack of buying momentum to sustain at the 20 day EMA mark.
Amidst the market bearishness, the token moved sideways in a narrow range for the past few weeks and signifies a reduced investor interest in it. If AR crosses the $20-50 zone in either direction, a sharp one-sided move could be seen.
Arweave (AR) Swims to Bottom: What’s Next?
As the past trend showed that, AR found support multiple times near the $20 mark and pulled back from there. This time, the same was anticipated by the investors and so began the accumulation.
However, the clarity was not there and lack of follow on buying was visible on the charts. A break and close above the $24 mark confirms the clear pullback sign and investors are waiting for it.
At press time, AR was trading at $21.90 with an intraday drop of 9.36%, reflecting neutrality on the chart. Its trading volume noted a sharp spike of over 135% to $172.36 Million.
The pair of AR/BTC is at 0.0000383 BTC, and the market cap is $1.44 billion. Analysts are neutral and suggest that the Arweave price may flip the gains and could see a recovery ahead.
Its RSI curve placed around 35, below the midline region and a convergence with the signal line noted. Still, lack of clarity there and indecisiveness observed, buyers need to gain further traction to resist the selling pressure.
Once it climbs the 200 day EMA, a short covering move would be triggered, which leads the token toward the $30 mark.
@Decilizer in his tweet said that AR token has a strong immediate support zone around $17 and was respected multiple times in the past. A potential rise toward the $43 mark could be anticipated with the market recovery ahead.
Weighted Sentiment Data Showed a Dip
This week, a sharp decline in the weight sentiment data observed and the value reach the negative territory, note at -0.936, convey a bearish outlook
Likewise, the price volatility curve revealed a drop over 12% in the intraday session. It implies the reduced trading activity in the intraday session.
Total Liquidations Chart
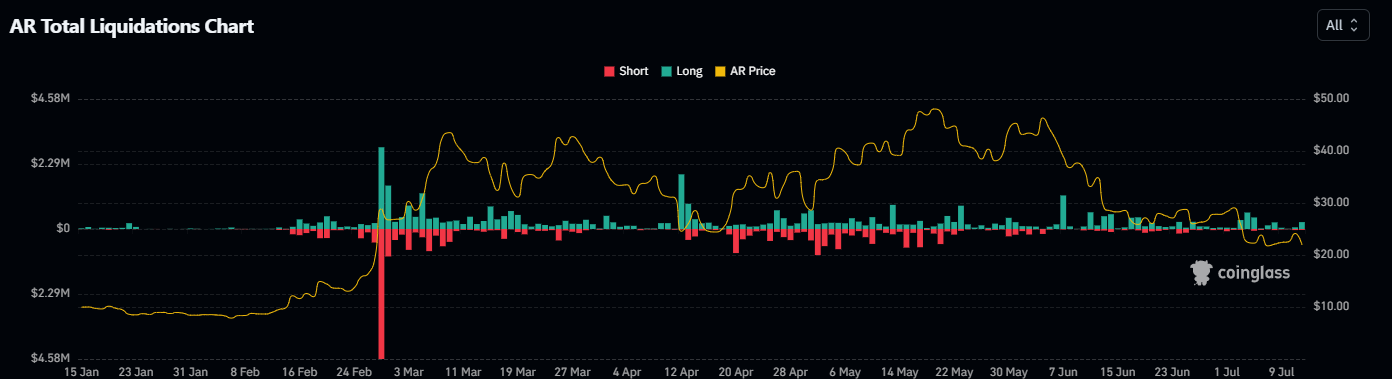
At the time of writing, the long liquidations were much higher than the short liquidations. This conveying the bears presence was strong and the token might face further declines ahead.
The immediate support levels for AR are $1.80 and $1.30, whereas the key upside hurdle is around $2.40, followed by $3
The Arweave token price faced rejection from the 20-day EMA mark and still hovered near the demand zone. Buyers have attempted for a recovery and are looking to cross the $24 mark for a significant bounce ahead.


