


ONDO showed fascinating growth of nearly 30% in the past two weeks. Intraday, it grew just 2%.
Tradingview data shows its all-time high is $1.48, and the current price is 29% below that marke as of writing. While the all-time low was $0.1965, and the price is 400% higher.
The market cap is $1.491 Billion, ranking among the top 100 global crypto’s list at 59th. Its 24-hour volume looks good ($135.65 Million).
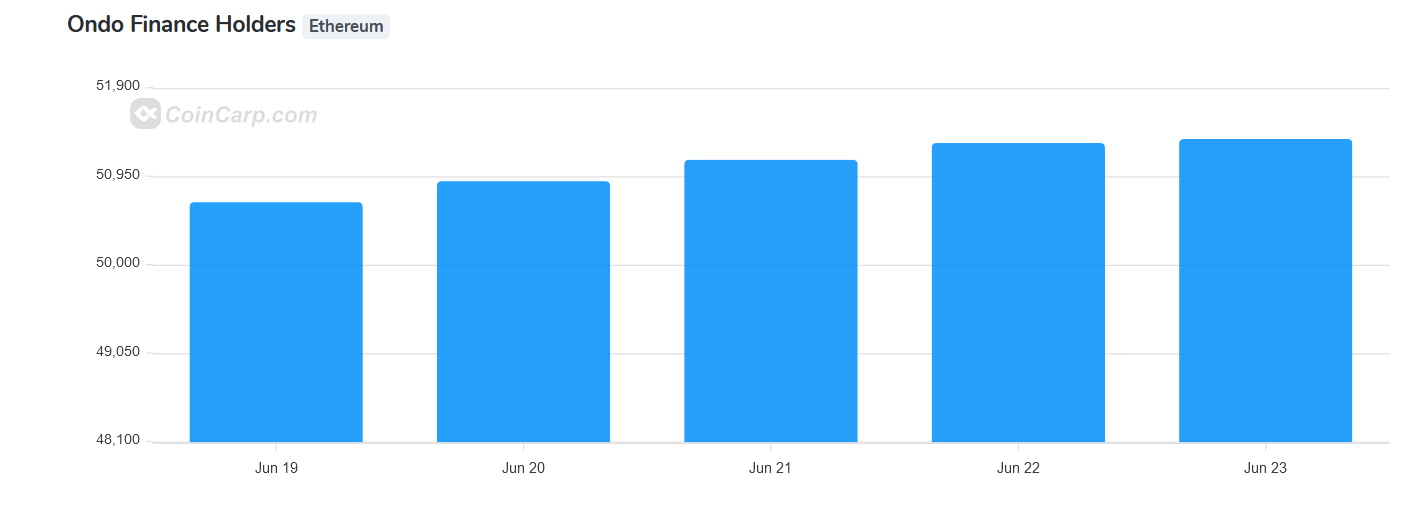
1.389 Billion ONDO (13.89%) have been circulating out of 10.0 billion ONDO. The rich list highlighted that the total holders are 51.3K. The top 10 holders’ addresses hold 86.13% of the circulating supply.
Total Value Locked
TVL exhibited that since the start, it has advanced massively in ONDO, from $200 Million in March to $56.45 Million. By July 18th, 2024, the TVL has surged almost 3x.
This advancement highlights confidence and active participation among ONDO holders and stakeholders.
Decoding ONDO’s Daily Chart
ONDO broke out earlier in mid-May 2024 from a symmetrical triangle pattern hitting the $1.47 mark. Still, the supply pushed away, which formed support at $0.8752 by July 8th in resonance with BTC price activity.
The broader picture showcases on the daily chart that the price was hitherto in an upward channel. However, as BTC dipped, Coin fell sharply and breached the channel’s lower border.
The overall sentiment turned bearish as its price structure became bearish, forming a bearish pattern, precisely a rising wedge pattern.
Despite the bearish overall sentiment, the hopes are still alive as the ONDO surged from a critical support level on July 8th. However, BTC stopped as it encountered resistance, and so did the ONDO price, which was met at $1.15.
Looking more closely, once BTC crosses the historical level of $66K, ONDO Finance would most likely surpass the $1.15 hurdle. If this happens, ONDO would re-enter its upward channel and continue its trading activity in the wedge.
Price Indicators
The recent bullish sentiment developed in the past two weeks signifies that the 50-day EMA band seems likely to jump sooner.
Meanwhile, other tech tools like MACD and RSI signify a bullish outlook in ONDO. MACD has shown a bullish presence despite being in the bearish territory. It depicted the current sentiment based on price action, which is bearish in the larger outlook.
However, in shorter aspects, the trend has turned bullish. Contingent on buyers, this lesser outlook could also become significant once prominent critics are met on the daily price chart.
ONDO Price Forecast (Resistance and Support Levels)
Based on recent structure and sentiment, if the interruptions are cleared at $1.15 and $1.45, the price could generate a new all-time high of $2.00. This would be a 2x gain.
However, if larger sentiments dominate the lesser sentiments, ONDO could decline heavily towards previous lows. The life-saver would be at nearly $0.87 and $0.68, and once these are taken, a final layer of support in the ONDO would be $0.3850.
ONDO price surged 30% in two weeks but is 29% lower than its all-time high. It has good liquidity and a market cap of $1.49 Billion. The price could reach a new high of $2 if it breaks resistance at $1.15 and $1.45.







