


Stellar (XLM) price action witnessed sideways movement for weeks. But the coin is ready to move out of this patter.
At press time, XLM price was up over 11% in the last 24 hours, confirming a breakout from a bullish flag pattern.
After weeks of sideways action, XLM may finally be ready to move higher, potentially as far as $1, if key technical indicators continue to hold strong.
From the liquidation setup to rising buying pressure and retail sentiment, all signs point toward another leg up. But one on-chain metric still shows a risk worth watching.
XLM Price Eyes 133% Upside As Stellar Breaks Bullish Flag Pattern
XLM price broke out of a classic bullish flag pattern. In technical analysis, a flag pattern forms when prices move sharply higher (the pole), then consolidate in a downward-sloping range (the flag), before breaking out again in the same direction.

The XLM price chart depicts the height of the original flagpole, from around $0.23 to $0.52, to be about 133%.
A move toward the key psychological level of $1.00 emerges as the new target, using that same height from the breakout zone.
This type of structure typically shows strong market interest and sustained buying. The breakout candle was backed by high volume and is now pushing past short-term resistance near $0.46.
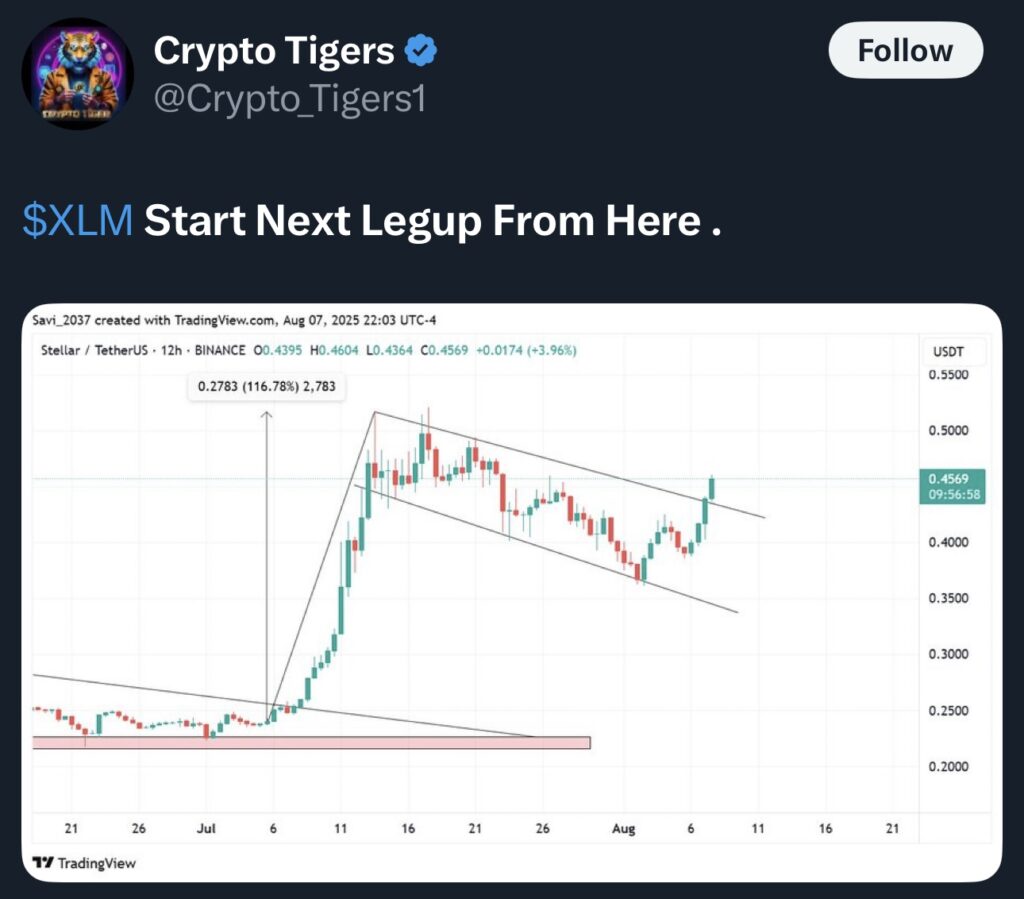
However, to confirm the rally, the first move has to be past $0.52. Do note that this analysis aligns with the expert analysis on X.
Short Squeeze May Continue With Over $60M in Shorts Still Open
According to the latest liquidation map, many short positions have already been wiped out, but over $52 million in XLM short contracts are still active on Bitget alone. That’s fuel for more upside.

When the XLM price rises quickly, traders betting against Stellar (shorts) are forced to buy back their positions, which pushes prices even higher.
This is known as a short squeeze. It’s what helped XRP rally recently, and Stellar price could be next.
If bulls maintain pressure and spot buying increases, XLM could trigger another liquidation cluster, possibly helping push prices to $0.52 and beyond.
What’s coincidental is that the peak of the short-liquidation cluster sits at $0.52, a level also mentioned on the price chart.
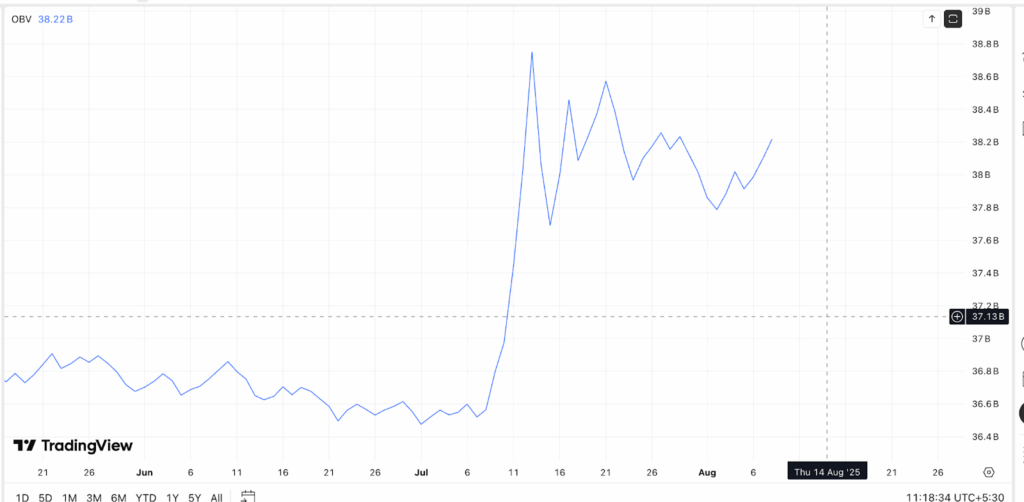
OBV and Bull-Bear Power Confirm Momentum
The On-Balance Volume (OBV) is climbing again, forming higher highs alongside price. This is a bullish signal for XLM price.
OBV tracks the running total of trading volume, adding volume on up days and subtracting it on down days. Rising OBV with rising price means demand is increasing.
The Bull-Bear Power (BBP) index is flashing green. This tool measures the difference between the highest price buyers are willing to pay and the lowest price sellers are interested in accepting.
A positive, or rather green, BBP indicator during a breakout shows that buying strength is in control.

However, there’s one reason for trading-specific caution.
30-day net exchange flows have turned positive again, rising from under $1 million last week to over $9 million this week. This means more XLM is being sent to exchanges, possibly for profit-taking.
Traders Are Long, With $1 in Sight for Stellar Price
As per what Binance long/short ratio shows, almost 60% of trader accounts are currently long XLM. That means a growing bullish sentiment is in the works in retail circles.
While not extreme, this is enough to support continued price strength, especially if institutions join in.

As long as XLM price stays above $0.46 and bulls maintain volume, a move toward $0.52 is likely. Beyond that, $0.60 and $1.00 remain potential breakout targets based on the full flagpole extension.
However, the short-term setup gets invalidated if price dips back below $0.36, especially if netflows rise further.


