Key Insights
- Bitcoin ETF inflows reached $998.95M Monday, the ninth-largest daily total since spot funds launched.
- Crypto ETFs entered focus as Bitcoin price tested the $83K-$86K holder supply zone.
- Bitcoin short liquidations reached $345M as price entered a dense liquidation range.
Bitcoin price traded near $86,000 on Tuesday after reaching its highest level since January. Bitcoin ETF inflows added a clear spot-market signal to that move. According to CryptoQuant data, U.S.-listed spot Bitcoin ETFs posted $998.95 million in net inflows Monday, their largest daily total since Bitcoin’s October 2025 record high. The flow placed crypto ETFs back in focus as Bitcoin entered the $83,000-$86,000 supply zone.
Bitcoin briefly touched $86,502 in the reported session after gaining more than 10% from the prior Sunday close. ETF demand did not operate alone. Bitcoin short liquidations reached $345 million, adding buy-side pressure as short positions closed. The move places Bitcoin in a dense holder supply zone from $83,000 to $86,000.
Monday Ranks Ninth Among Daily Spot Bitcoin ETF Totals
Monday’s Bitcoin ETF inflows ranked ninth among daily net additions since U.S. spot funds began trading in January 2024. They also marked the largest daily figure since October 6, 2025, when Bitcoin reached roughly $126,200. The three-day positive run was the first in two weeks.
BlackRock’s IBIT led with $381.37 million, followed by ARKB at $289.12 million and Fidelity’s FBTC at $238.84 million. The three funds provided most of the day’s total. September’s cumulative flow reached $1.31 billion, down from $3.52 billion in August.

Trading volume across the Bitcoin ETF market exceeded $4.5 billion on Monday. That figure measures share turnover, while net inflows record new capital entering or leaving the funds. Both measures rose as the Bitcoin price moved through the mid-$80,000 range.
Crypto ETFs net flows reflect creations and redemptions in fund shares. They do not identify the timing or venue of underlying Bitcoin purchases. ETF share creation can support underlying purchases, but it does not map every intraday trade.
Spot Bitcoin crypto ETFs still show a roughly $450 million year-to-date deficit. Glassnode’s weekly snapshot also placed net flow at around $300 million negative. Monday’s inflow improves the daily picture without reversing either of the broader measures.
Bitcoin ETF Inflows Meet a Dense $83K to $86K Supply Zone
Glassnode estimated that long-term holders acquired most of 1.07 million BTC between $83,000 and $86,000. The largest concentration lies near $85,000. Those coins moved little during the 30-day review window.
Bitcoin ETF inflows now arrive as the Bitcoin price returns to the estimated cost range for that supply. Investors reaching breakeven may reduce exposure. Sustained spot demand can also absorb coins offered into the market.
ETF investors have regained a key price area. The aggregate fund complex traded below the $83,000-$86,000 band for 228 consecutive sessions. Its aggregate unrealized losses reached about $18 billion at the February low.
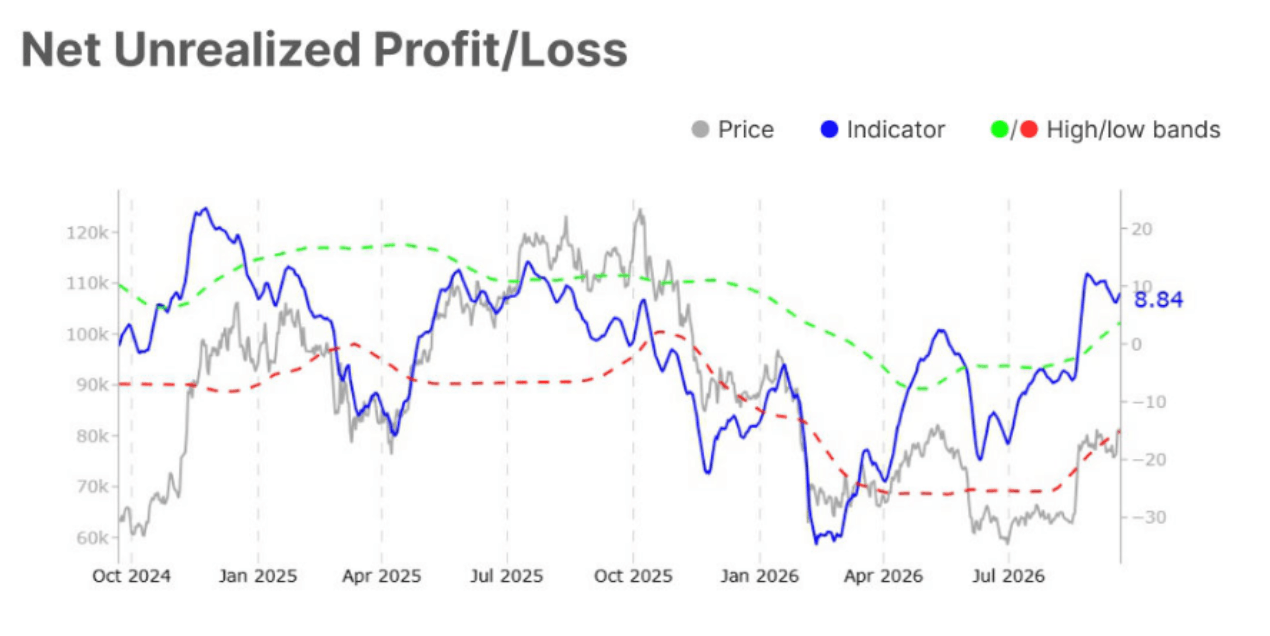
Glassnode reports that about two-thirds of Bitcoin supply is in profit. It also places realized profit-taking above its normal range. The figures identify a cost-basis area where market participants may reassess exposure. Prices will test that view.
Bitcoin ETF Inflows and Short Covering Test the $86K Level
Bitcoin ETF inflows coincided with a derivatives-led acceleration. At least $345 million in Bitcoin shorts closed during one day as price moved higher. Short covering adds demand when traders close bearish positions. Futures open interest and funding also increased, showing greater leverage as the rally developed.
Glassnode said modeled short-liquidation levels from $82,000 to $86,000 grew 21% since the August 19 squeeze. A sustained move through $86,000 would move Bitcoin beyond a dense modeled liquidation band. It would also test whether fresh spot demand can absorb holder supply.
According to CoinRepublic’s BTC price analysis, $87,000 is the next level to watch if Bitcoin holds above $85,000. $90,000 and $92,000 are the next key resistance price zones. Bitcoin ETF inflows, holder supply, and leverage data are key indicators as BTC trades around these levels.
This article is for informational purposes only and does not constitute financial or investment advice. Cryptocurrency and derivatives trading involve substantial risk.