



Key insights
- Bitcoin price in USD is near $61,900, with $60,000 as the next major support.
- BTC ETFs lost $582 million on November 19; Ethereum ETFs lost $131 million.
- Darkfost estimates short-term holders are realizing average losses near 15%
Bitcoin price USD slipped to around $61,834 on November 20. BTC had already fallen below $62,500, the lower edge of its recent range. As BTC fell 2.47% in a daily decline and 9.78% in a weekly fall, the prolonged sell-off followed a retreat from the 86,000–87,000 range seen earlier in October.
U.S. spot Bitcoin ETFs posted $582 million in outflows on November 19, adding another concern. Peter Brandt questioned whether the decline resembles earlier reversals after Bitcoin bull phases. Meanwhile, the BTC/USD TradingView chart shows a double death cross, bringing Bitcoin’s $60,000 support area into sharper focus today.
Bitcoin Price USD Draws Brandt Warning on Past Cycles
Brandt wrote on X that each previous Bitcoin bull phase ended with a correction of at least 75%. He measured those corrections against the preceding parabolic advances. He then asked whether the current downturn could follow the same pattern. His post offered no date or price target for a comparable move.
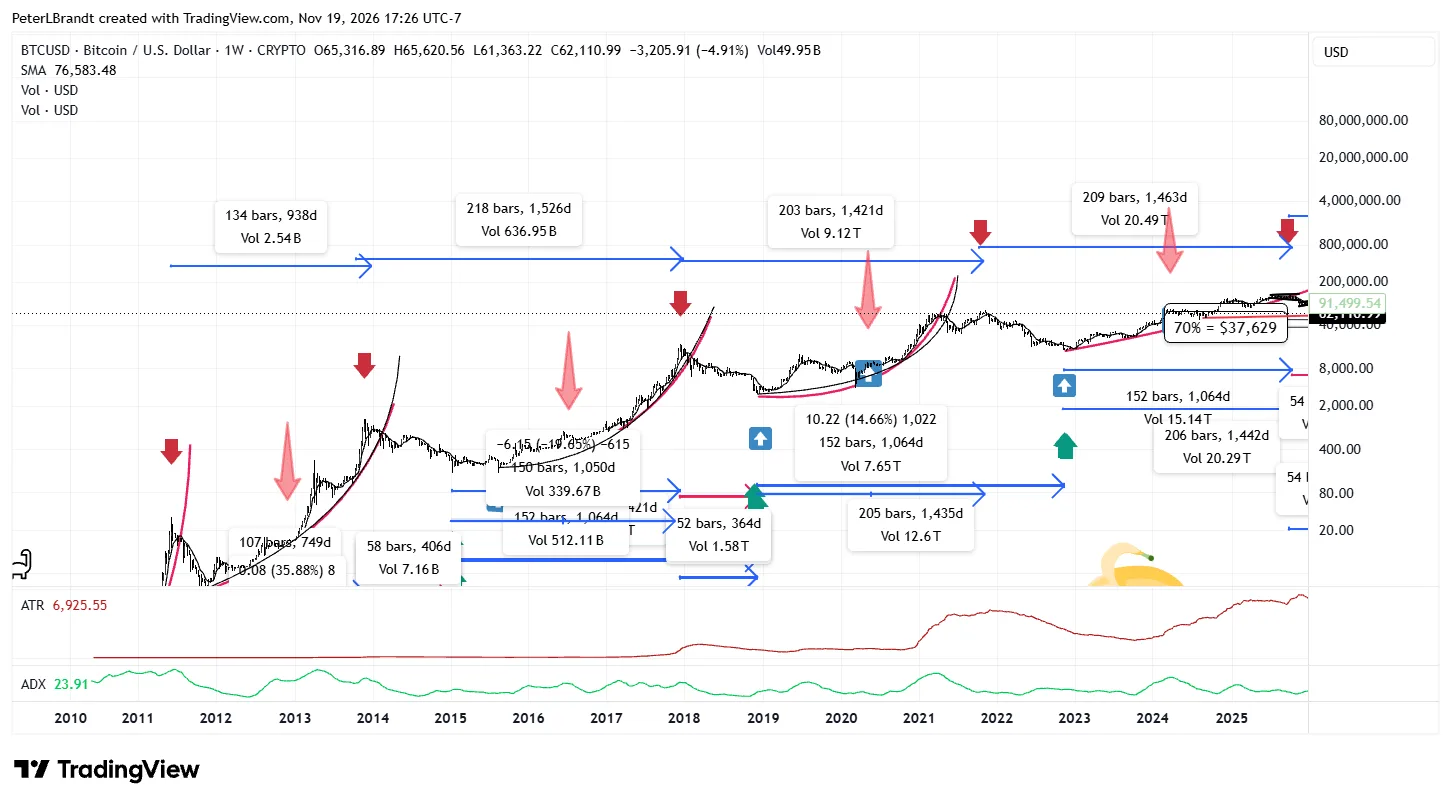
The Bitcoin price USD snapshot near $61,834 placed BTC about 51% below its October 2025 peak of around $126,200. The historical comparison supplies no forecast of a further 75% fall from today’s price.
Crypto market expert That Martini Guy identified $62,500 as the former floor of Bitcoin’s recent range. Once the BTC price slipped beneath it, the level became a potential barrier to recovery. A move back above $62,500 would show whether that breakdown has lasting force.
ETF Outflows and Holder Losses Add to Bitcoin Pressure
U.S. spot Bitcoin ETFs recorded $582 million in net outflows on November 19, their third straight day of withdrawals. Spot Ethereum ETFs lost $131 million, extending their outflow streak to five days. SoSoValue data showed continued redemptions as Bitcoin weakened. ETF flows measure net creations and redemptions; they do not prove every dollar became an immediate Bitcoin sale.
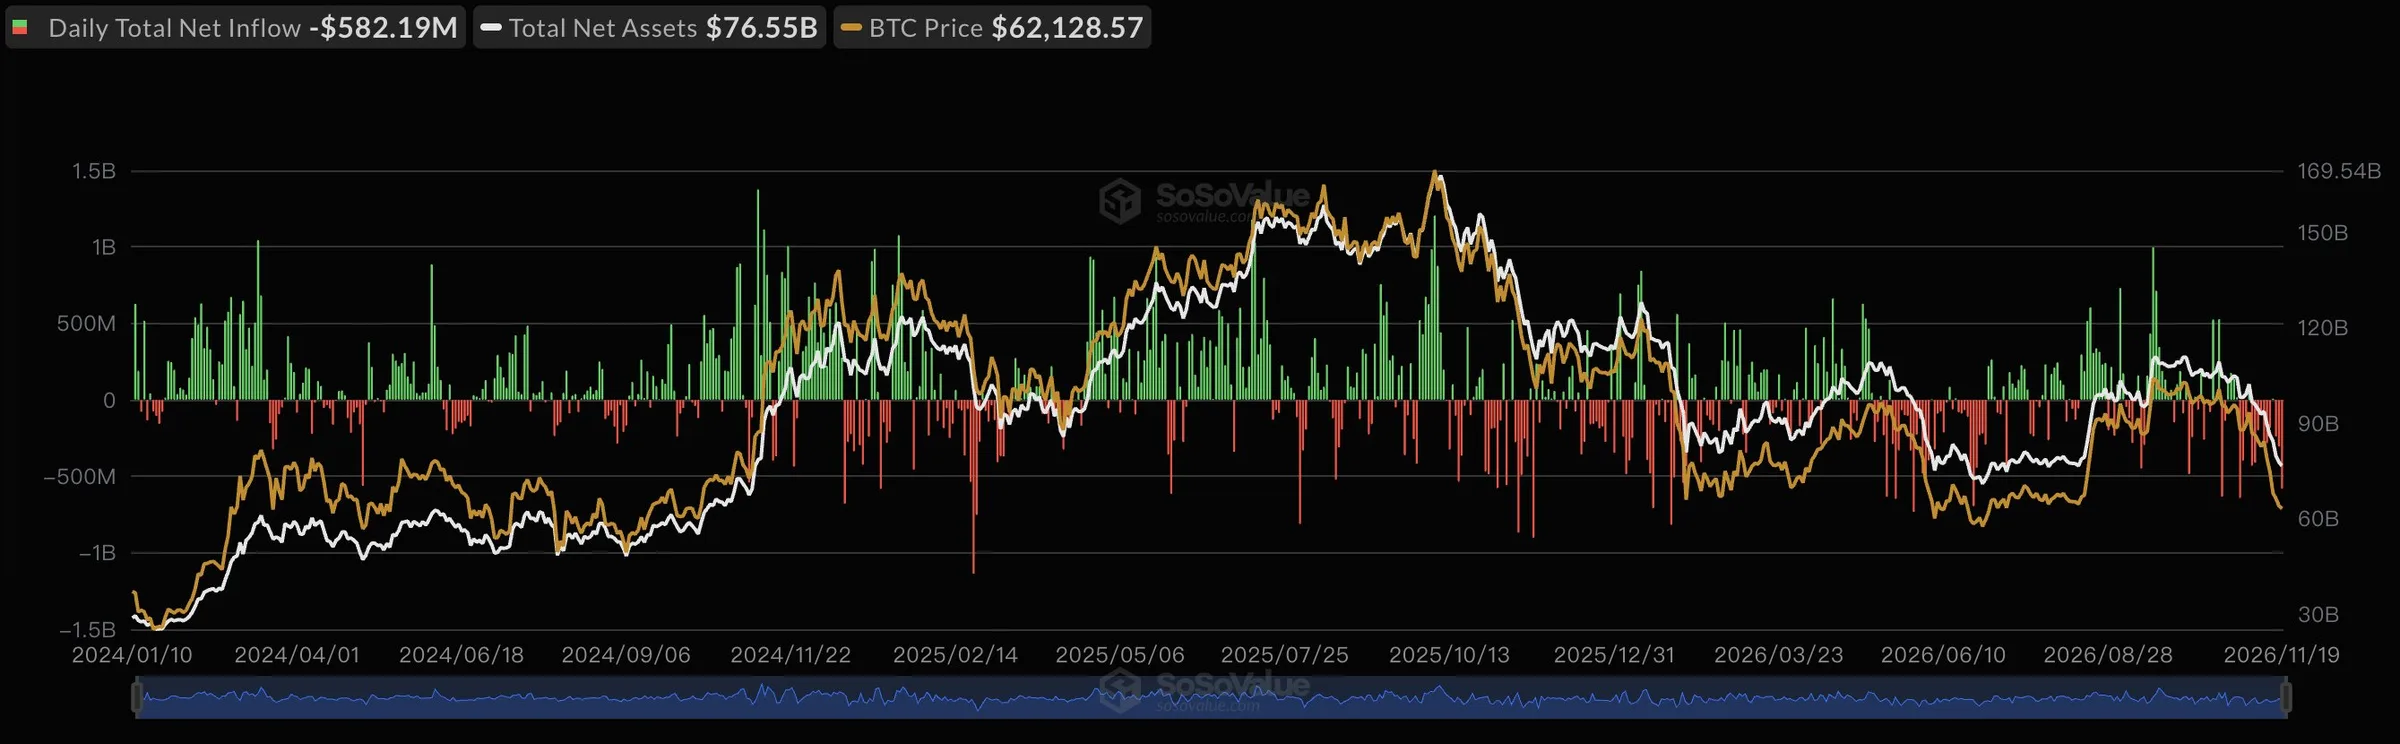
Bitcoin price weakness in USD has coincided with these withdrawals and a broader drop in appetite for risky assets. As reported by The CoinRepublic, interest rates, dollar strength, and shrinking stablecoin supply are strains on the Bitcoin crypto market.
CryptoQuant analyst Darkfost said short-term holder SOPR below 0.993 signals that recent holders are selling at a loss. The measure compares the value of coins when spent with their value when acquired.
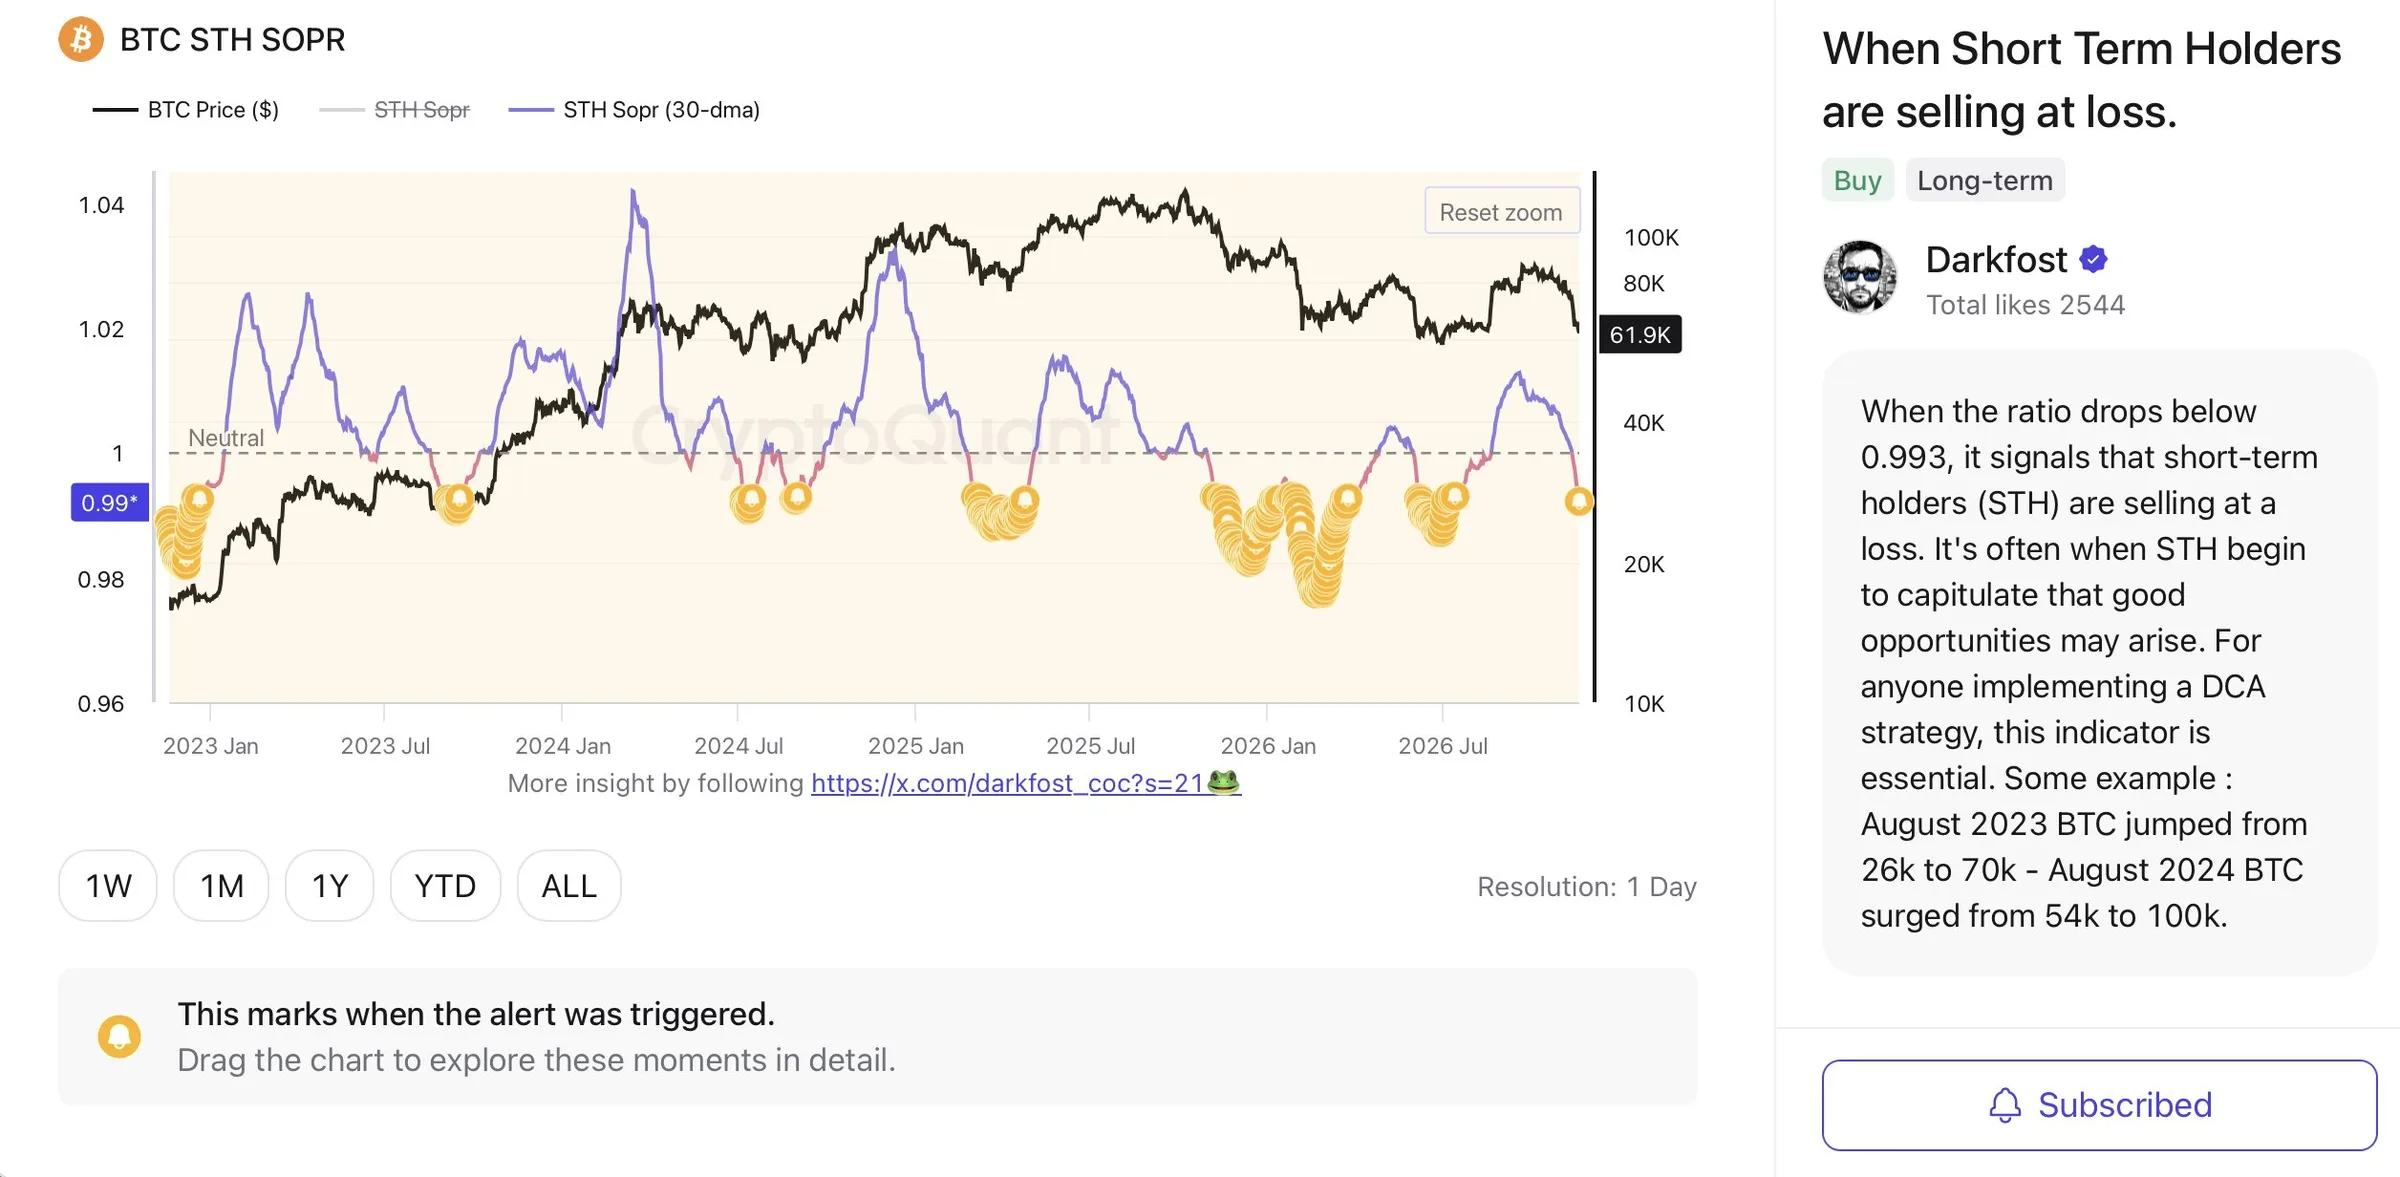
Darkfost estimated average realized losses near 15% for that group. More loss-making BTC has reached exchanges, which the analyst viewed as evidence of actual selling.
Darkfost said such stress can coincide with potential entry points during bull phases. He also cautioned that losses can last longer during bear markets. That leaves the timing of any price recovery uncertain.
Bitcoin Price USD Tests $60,000 After Bearish EMA Crosses
The BTC/USD chart from TradingView identifies two bearish EMA crossovers. The averages include the 100- and 200-period EMAs. The analysis describes the setup as a double death cross. Such patterns follow earlier price declines, so their presence alone cannot predict how far Bitcoin will fall.
The Bitcoin price USD chart also shows moving averages clustered around 75,000–76,000, leaving resistance above the current level. RSI has approached oversold territory, indicating stretched downward momentum. An oversold reading can precede a rebound, though it cannot establish a price floor.
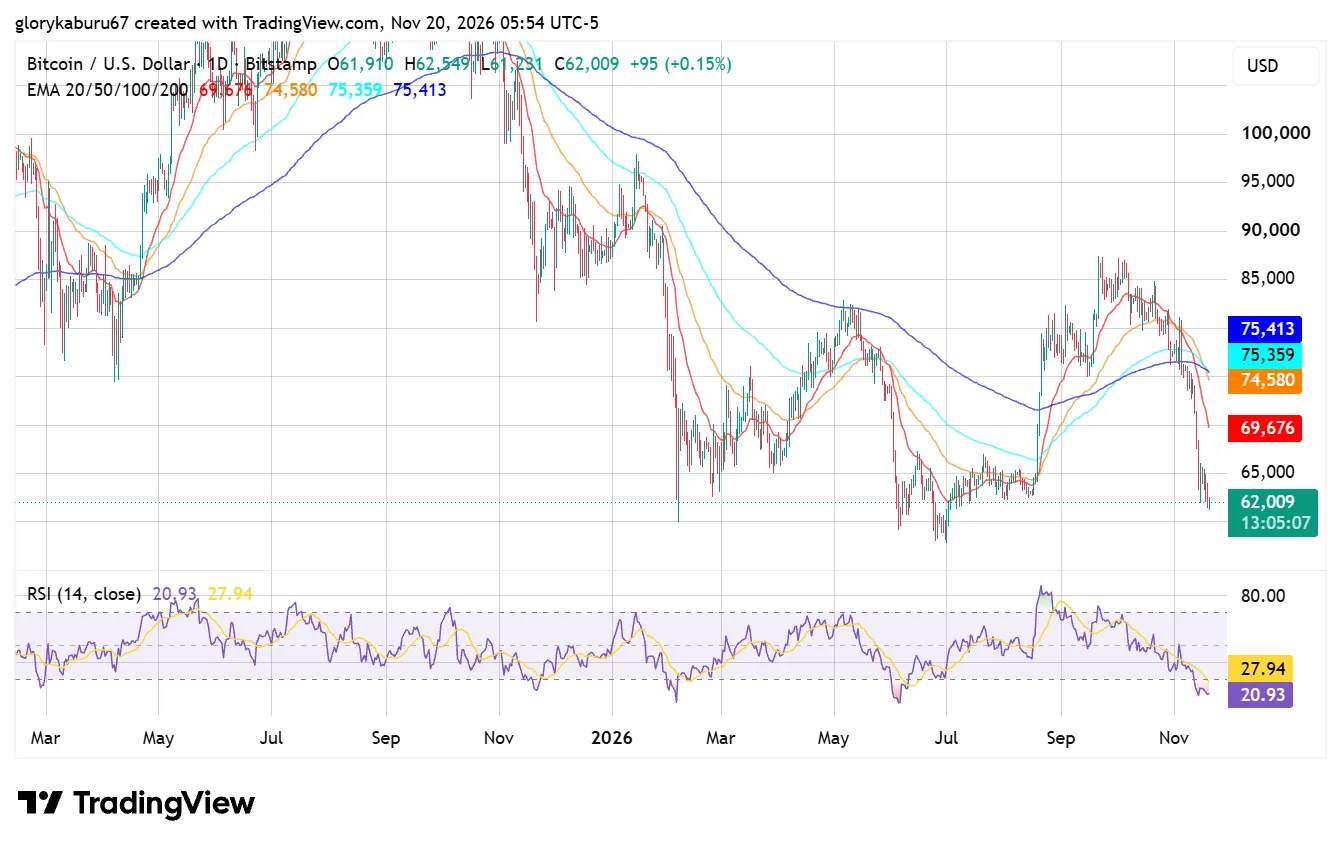
Bitcoin price USD is now close to $60,000, a level buyers watched during June’s correction. A sustained move below that support could bring $58,000 into view, followed by $56,000. These are potential support levels rather than fixed targets.
On the upside, Bitcoin needs to reclaim $62,500, followed by 64,000–65,000 for a stronger short-term rebound. A break above $68,000 would offer a clearer sign of stabilization. The higher moving-average cluster around 75,000–76,000 would remain the next major chart obstacle.


