
 Home
Home News
News

- The bears are showing no mercy for ether price as it is reaching the crucial level of $100
- Ethereum trading price facing significant overall loss in today’s market of -17.30%
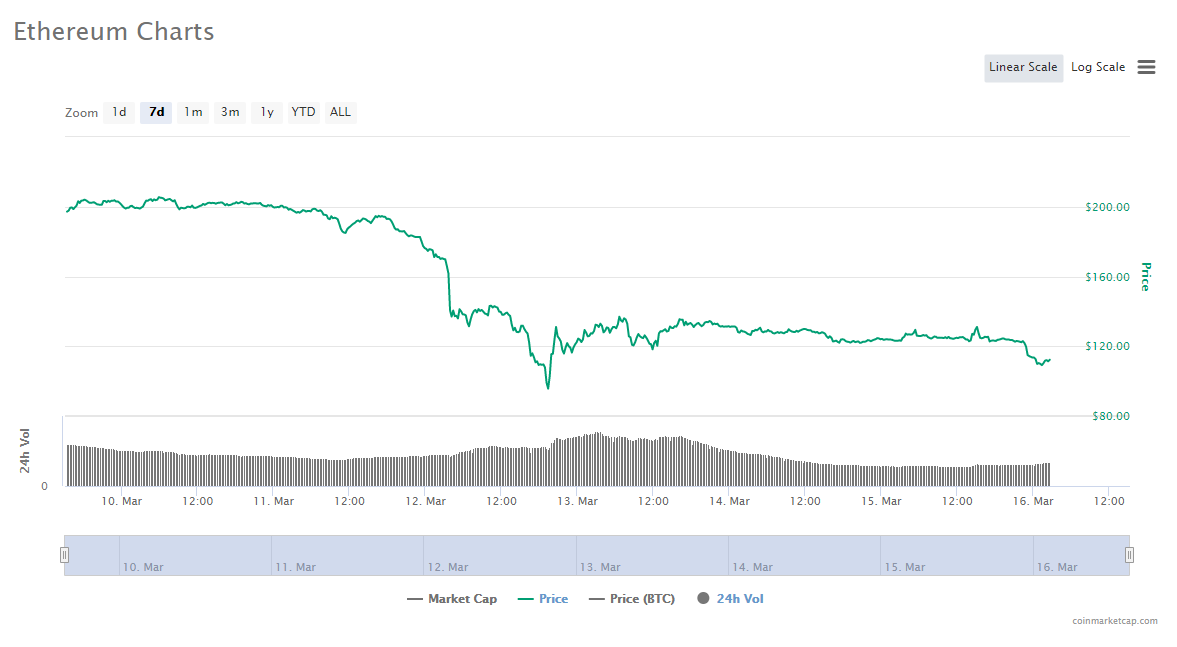
On the 7day-weekly chart, ether started off by breaking below the crucial level of $200. The overall downtrend in the market indicated that it will be facing negative momentum in the market for a while. However, no one expected that the downfall will be so significant that ether will be facing a critical price level of $100.

Ether broke the crucial level of $100 on 12th March 16, 2020, but suddenly had a positive push by the strong support level of $98.00. The price level reaching below $100 for ether can result in a major downfall for the cryptoasset.

Another bearish aspect for ether is continuous declining market capitalization and volume traded. During the price recovery stage at the end of February, ether was at the price level of $245. The market capitalization and volume traded were $26 billion and $24 billion respectively. However, now the market cap and 24h volume traded is $12 and $13 billion respectively.
Another fall below the price level of $100 will weaken the support level of $98.00 and the cryptoasset may plunge more this time. However, after breaking below the price mark of $110.00, ether is reviving its buying volume.
Ethereum Technical Analysis
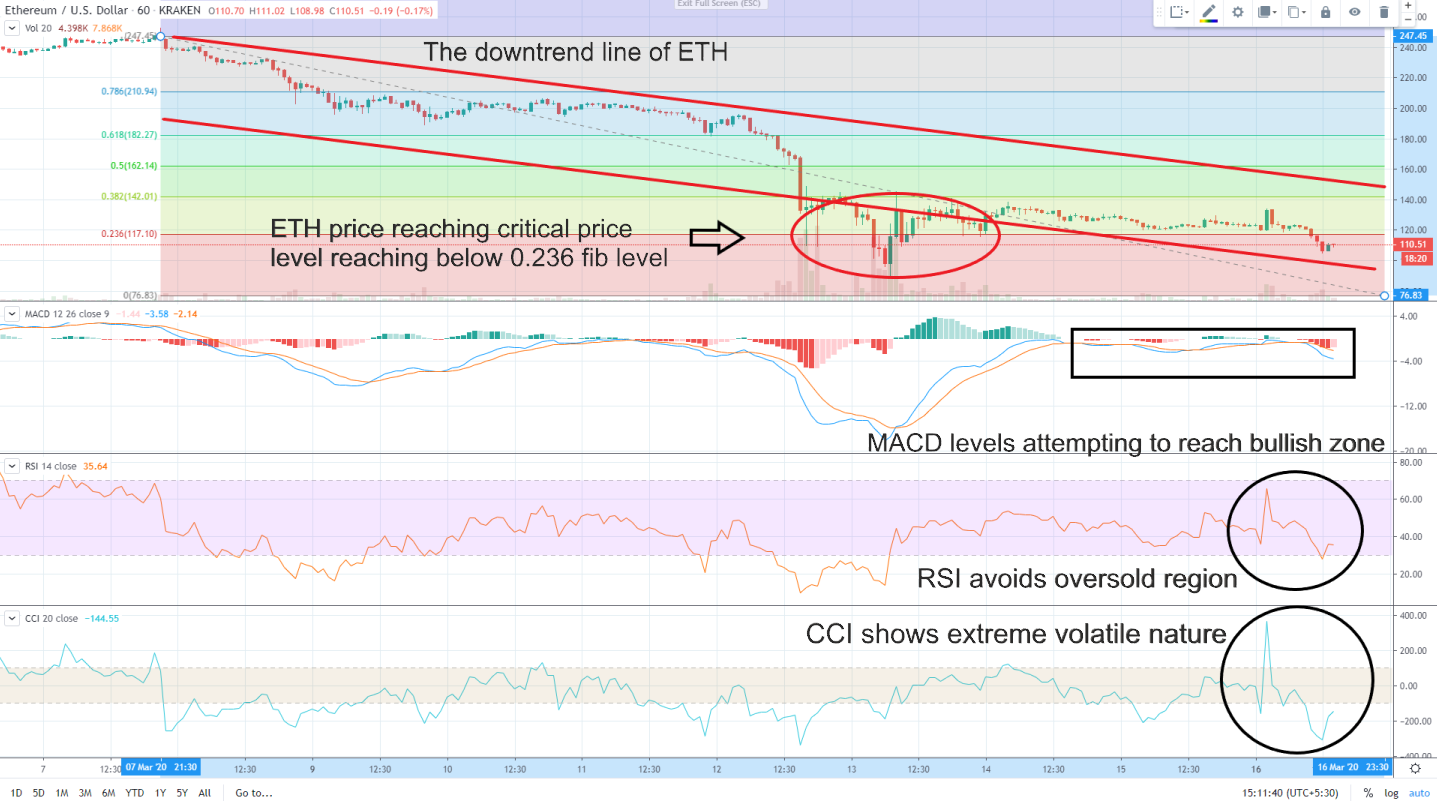
The technical chart indicates that the level of $100 can be a good buying opportunity for investors. Also, the fib retracement level is below 0.236 and ether have always bounced back after touching that low level. This can be a positive sign for ether for ethereum price recovery.
The MACD levels also show that ether is getting buying volume after breaking below the price level of $110. The buying volume also attempted to reach the bullish zone but was unsuccessful. However, this has indicated that ether is now capable of starting a positive movement in the market
The 24hr-RSI also avoided a negative divergence to the oversold region by reaching the depth of the normal territory. The positive divergence might help RSI to reach the level of 40.
The 24hr-CCi has been extremely volatile in today’s market. After touching the peak of the overbought region, it had negative divergence to the normal region which forced it to reach an oversold zone. However, it is still showing a positive trend and might reach a normal region again.
Resistance level: $120
Support level: $100 and $86
Mr. Pratik chadhokar is an Indian Forex, Cryptocurrencies and Financial Market Advisor and analyst with a background in IT and Financial market Strategist. He specialises in market strategies and technical analysis and has spent over a year as a financial markets contributor and observer. He possesses strong technical analytical skills and is well known for his entertaining and informative analysis of the Financial markets.


