
 Home
Home News
News

- Bitcoin cash prominently plunged from its 52-week high; skeptics believe the asset may breach its strong support level of $380
- The BCH/BTC pair currently stands at 0.01276 BTC with an intraday loss of -3.65%
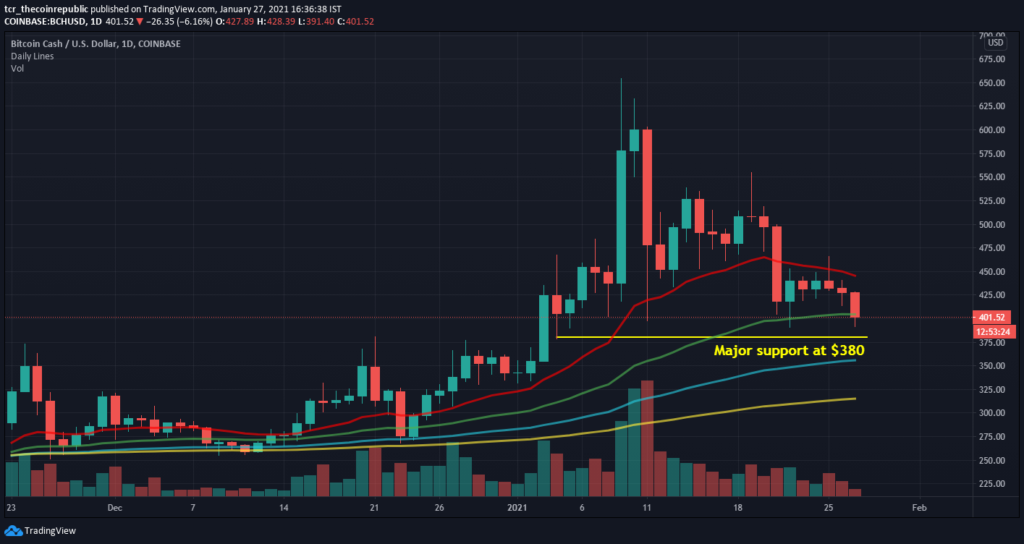
Bitcoin cash(BCH) is trading under pressure as it slipped down further from higher levels and presently trading at $395 with an intraday loss of -7.23%. After creating its new 52-week high of $630, BCH sank further and breached its support of $480, $420; however, it has managed to sustain above $380, which can be considered favorable for BCH. The major support levels operated in the upcoming trading session are $380 and $340. Similarly, resistance on the higher side is situated at $480 and $540, while $630 can be considered a strong resistance level. BCH is currently trading below 20-Day Moving Averages (DMA). However, it successfully managed to trade above major moving averages of 50,100 and 200.

Bitcoin cash price slips further on the daily chart after breaking the crucial mark of $420. BCH on the daily chart, is trading on a bearish note, with no significant sign of recovery from current levels, while the level of $380 becomes the only hope for investors. Likewise, resistance on the daily chart is placed at $420 and $480. The volume recorded in the intraday is $5,504,060,832, which dropped by -3.87%. Furthermore, the total market capitalization dropped over -7.16% and currently stands at $7,391,897,384.

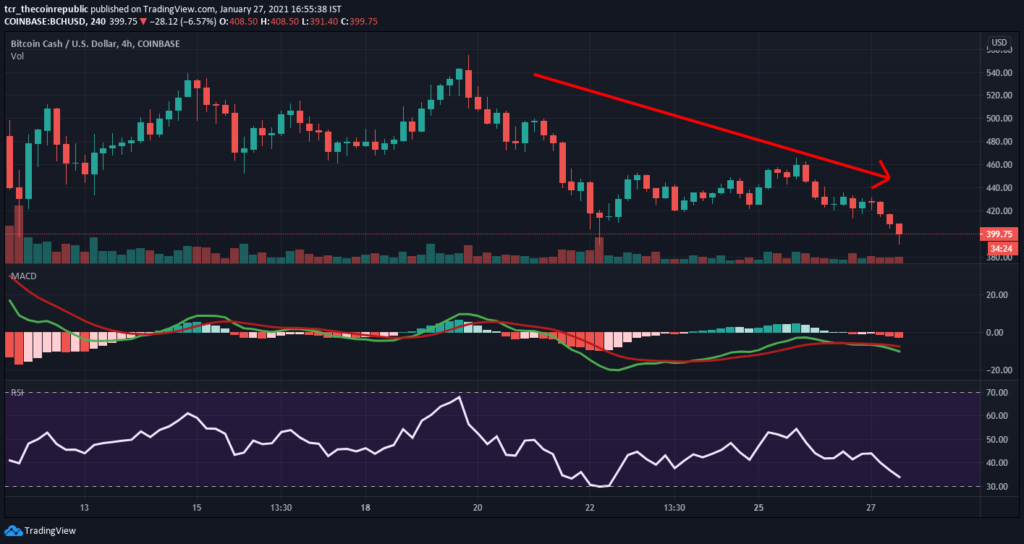
Relative Strength Index (Bearish) indicates a Bearish momentum while trading at 32.51. However, it is currently heading towards the oversold zone after falling from higher levels. However, a bounce is expected as it looks oversold.
Moving Average Convergence Divergence (Bearish) currently indicates a Bearish trend on the daily chart as it gives a negative crossover with the significance of sellers line(red) over buying signal line (green).
Support levels: $380 and $340
Resistance levels: $480 and $540
Mr. Pratik chadhokar is an Indian Forex, Cryptocurrencies and Financial Market Advisor and analyst with a background in IT and Financial market Strategist. He specialises in market strategies and technical analysis and has spent over a year as a financial markets contributor and observer. He possesses strong technical analytical skills and is well known for his entertaining and informative analysis of the Financial markets.


