
 Home
Home News
News

- LTC heading towards the supply zone, which is supported by the rising support line creating a bullish pattern
- The pair of LTC/BTC is trading near its 52-week low and tanks below 20,50,100 and 200-DMA CMP at 0.003582 BTC with an intraday loss of -1.99%
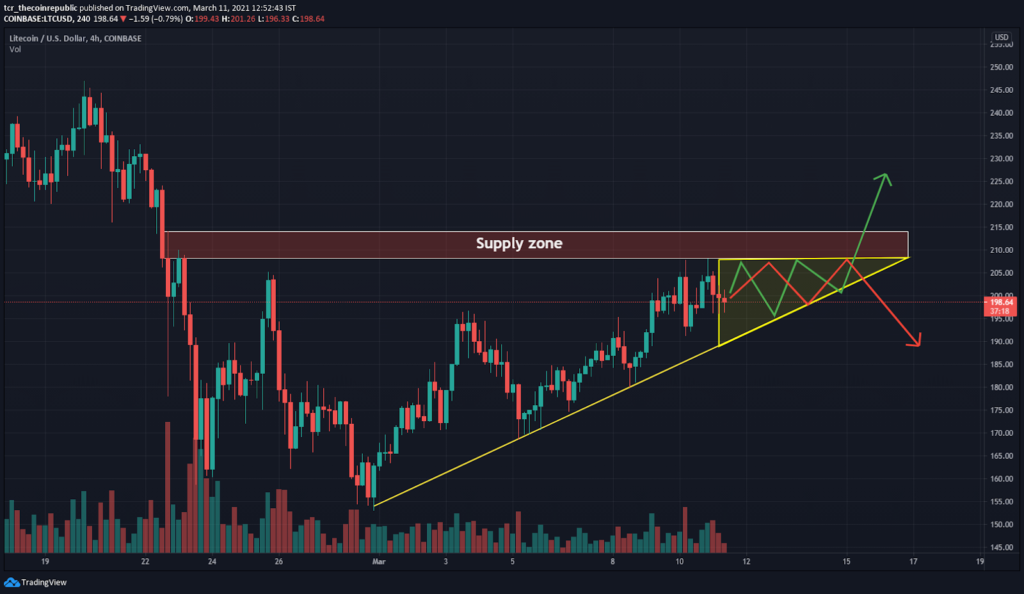
Litecoin price follows the rising support line while heading towards the major supply zone between $205-$215. The breakout from the formed pattern can lead to targets of $230 and $245, while if LTC cannot clear the supply zone, it can fall to the lower levels of $185 and $160. The higher side’s major resistance is situated at $215 and $240, while the support at lower levels is situated at $185, and $150 can be considered strong support. The current volume does not support a bullish breakout.

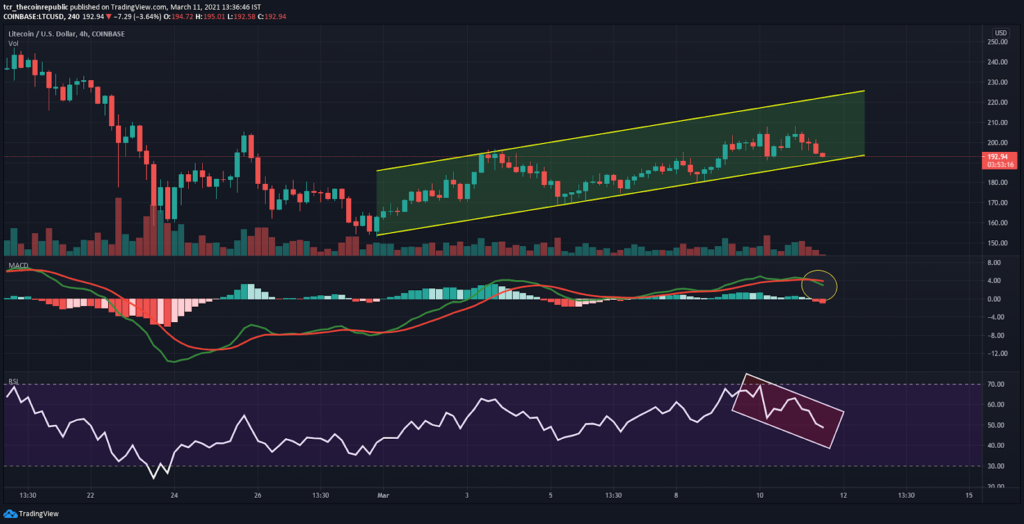
Litecoin price follows the rising channel pattern. However, it shows the divergence with the major indicators. Presently LTC is trading at $194 with an intraday loss of -2.05%; the volume traded in the last 24-hour is increased +1.41%. Likewise the total market capitalization dropped nearly -1.88% standing at $12,956,885,823. Over the daily chart, LTC finds its support around $184 and $165, while resistance on the higher side is $208 and $215. The overall conditions are not favoring bulls and can lead to a negative breakout.

Relative Strength Index (BEARISH) indicates bearish momentum while trading at 47.52. However, it is continuously heading towards the oversold zone after testing the overbought zone indicating its bearish trend on a shorter-term time frame.
Moving Average Convergence Divergence (BEARISH) currently indicates a Bearish trend on the daily chart, as it is trading with the significance of the seller’s signal line (red) and the buyer’s line (green). However, both lines are not giving any sign of recovery for upcoming trading sessions.
Support levels: $185 and $160
Resistance levels: $215 and $240.
Mr. Pratik chadhokar is an Indian Forex, Cryptocurrencies and Financial Market Advisor and analyst with a background in IT and Financial market Strategist. He specialises in market strategies and technical analysis and has spent over a year as a financial markets contributor and observer. He possesses strong technical analytical skills and is well known for his entertaining and informative analysis of the Financial markets.


