
 Home
Home News
News

- Binance coin price has reached the vertex of a symmetrical triangle
- Binance coin price testing the resistance of the triangle
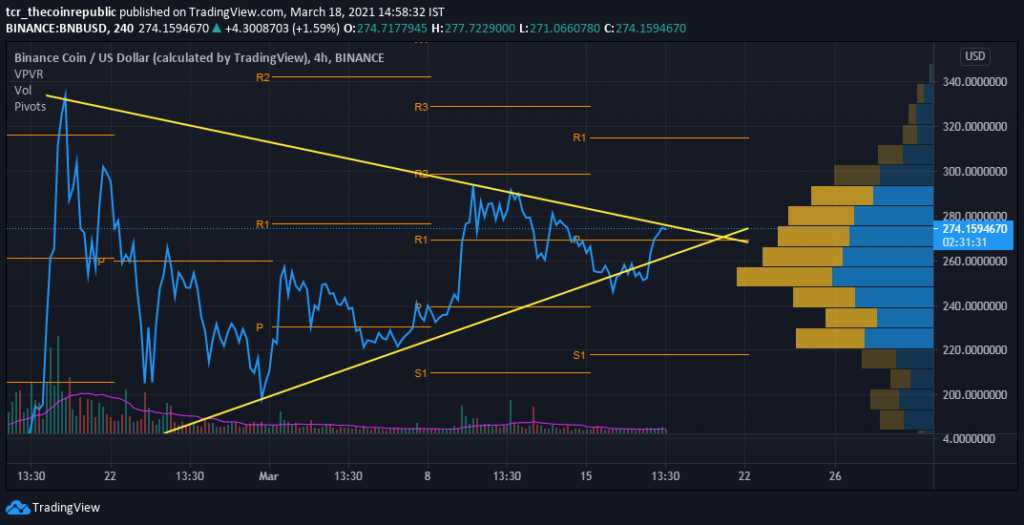
Binance coin has formed a symmetrical triangle, and the price has reached the vertex. Currently, it is testing the resistance of the triangle and may give a breakout. However, there is a change in volume so far, but the price range volume analysis indicates a higher number of buyers than the sellers. The market cap and 24-hour volumes are $13,636,499,261 and $3,944,480,112 respectively.

Rising Volume Indicates A Possible Reversal in Binance Coin
Left Image: The price analysis in the 4-hour time-frame shows a double confirmation along the support zones, which brought a small breakout with rising volumes. However, the price is currently experiencing hurdles at the resistance of the triangle. Crucial supports lie at $206, $232, and $260, whereas resistances lie at $297 and $345.

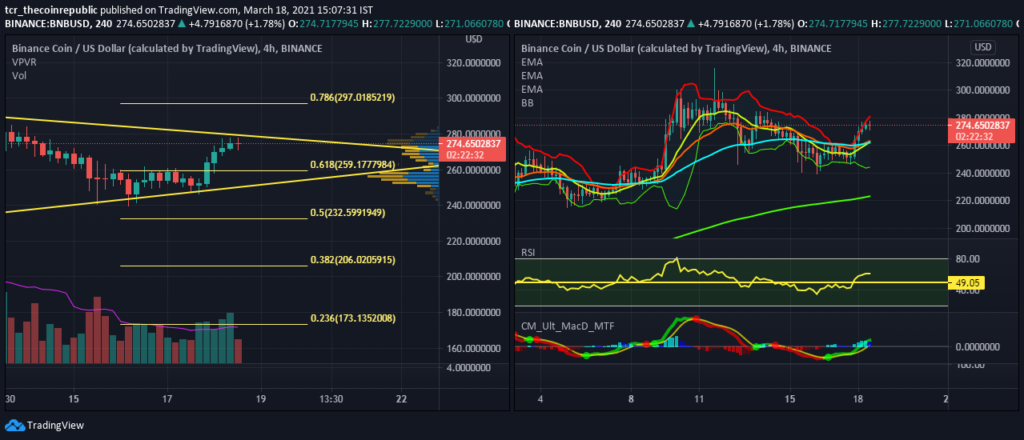
Right Image: The price has crossed over the 10-EMA, 20-EMA, and 50-EMA, which are now making a bullish crossover. The EMAs are clustered at $261-$263 levels and possibly acting as strong support for the coin. The 200-EMA is another crucial support at $223.
Bollinger Bands are pointing towards increased volatility due to the increase in volume at the time of breakout from the support. However, now the upper band is pushing the prices down from $280 levels while the 10-EMA(median) and the lower band are supporting prices at $262 and $244, respectively.
RSI is at 61, suggesting a bullish momentum; however, the indicator has lost its strength as the asset is making a Doji candle at the resistance, raising a possibility of further reversals. Support for the indicator lies at 50 and 35 levels, while resistance is at 70 and 80 levels.
MACD(8,21,5) has already emitted a buy signal in the negative territory and entered the positive territory, signaling a possibility of further continuation of the trend.
Conclusion:
Binance coin price has made a symmetrical triangle pattern and is currently testing its resistance at the vertex. The momentum oscillators are bullish but not strong enough to braid in the breakout from resistance. Volumes are needed to aid the price move up from the resistance.
Support: $173, $206, $233 and $260
Resistance: $275, $300 and $345


