
 Home
Home News
News

The cryptocurrency market started Wednesday’s trading session with some positive signs of recovery; however, Bitcoin (BTC) has been consolidating since the start of the week. Bitcoin (BTC) is still not able to break the $40,000 psychological barrier. On the other hand, Altcoins are trying hard to recover but are stuck into consolidation most of the time.

The below chart shows the market performance of different cryptocurrencies.

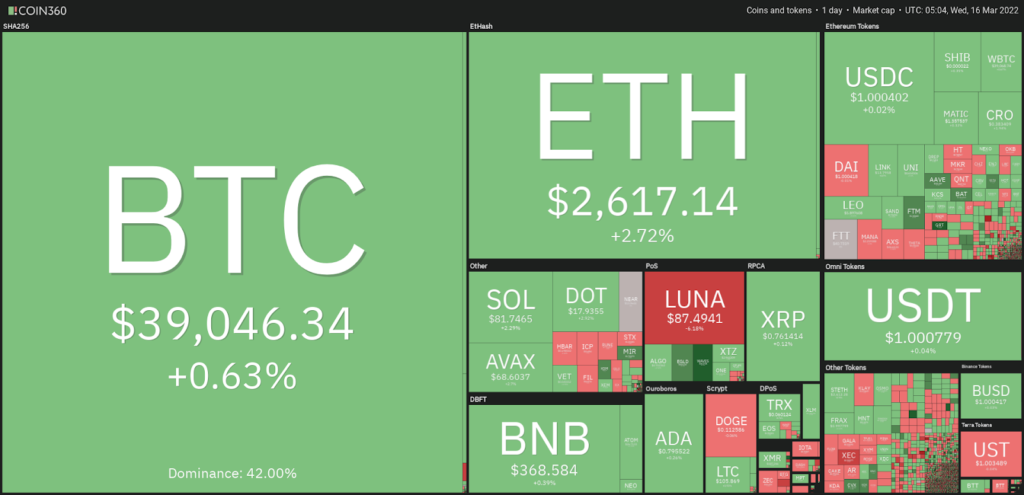
The heat map signifies the short recovery phase of Bitcoin and all other altcoins. The volatility which we had talked about in our prior discussions can be seen over the cryptocurrency market.
Let us cover the technical analysis of cryptocurrency like Bitcoin (BTC), Ethereum (ETH), Bitcoin Cash (BCH), The Graph (GRT), Basic Attention Token (BAT).
BTC/USD Chart Analysis
Bitcoin (BTC) price is stuck inside a symmetrical triangle pattern. However, BTC tried to sustain at the verge of the symmetrical triangle but failed to maintain at $41,717 mark. We can see BTC attempted to break the psychological barrier but failed to sustain it. Bitcoin price has the highest and lowest hits of $41,717 and $38,850 respectively in the last 24-hour period.
Bitcoin price is presently CMP at $39,300 and has gained 0.81% of its market capitalization in the last 24-hour period. The trading volume has also increased to 32.08% in the intraday trading session. The volume to market cap ratio is 0.04229.
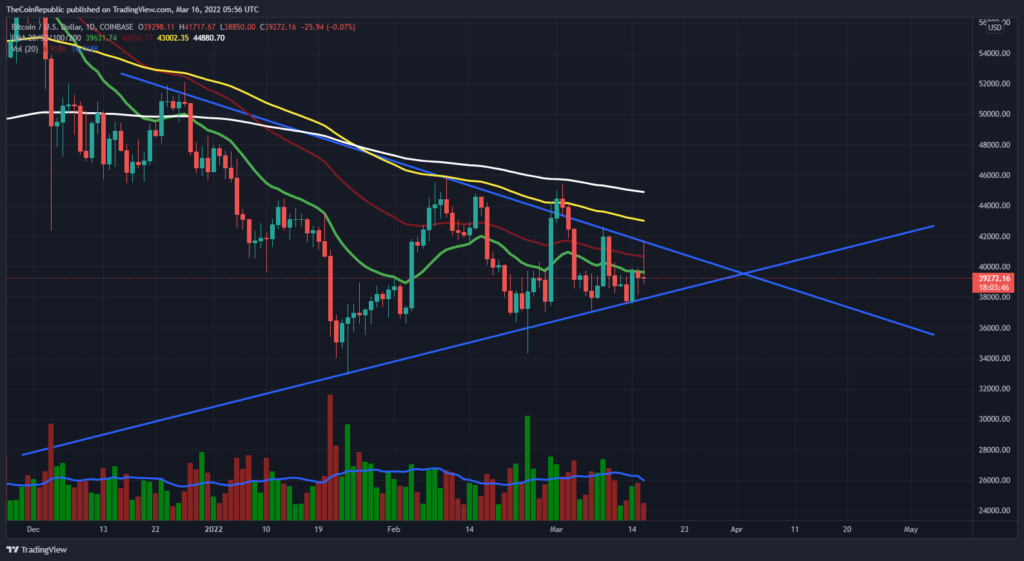
Bitcoin (BTC) price is trading inside a symmetrical triangle pattern and tried to sustain above the $40,000 psychological barrier but failed to keep its persistence. BTC investors are worried due to the high volatility factor of the cryptocurrency market.
Bitcoin price had a spike above $40,000 but failed to sustain as the volume change over the chart is below average and needs to grow for BTC to escape from the symmetrical triangle pattern.
The crypto asset has recovered above 20 and 50 SMA and is aiming for 100 and 200-days DMA. It’s a matter of time now to see if bulls manage to bring the momentum altogether and manage to sustain at the downward sloping line of the triangle. Then BTC investors may witness a successful bullish rally out of the triangle pattern.
ETH/USD Chart Analysis
Ethereum (ETH) coin looks to be in a strong uptrend over the daily chart. ETH Coin is presently CMP at $2635 and has gained 3.10% of its market capitalization in the last 24-hour period.
ETH Coin managed to attract buyers as trading volume has significantly increased by 40.03% in the intraday trading session. This signifies the buyers are getting involved and starting off the trading session with some positive hopes for ETH investors.
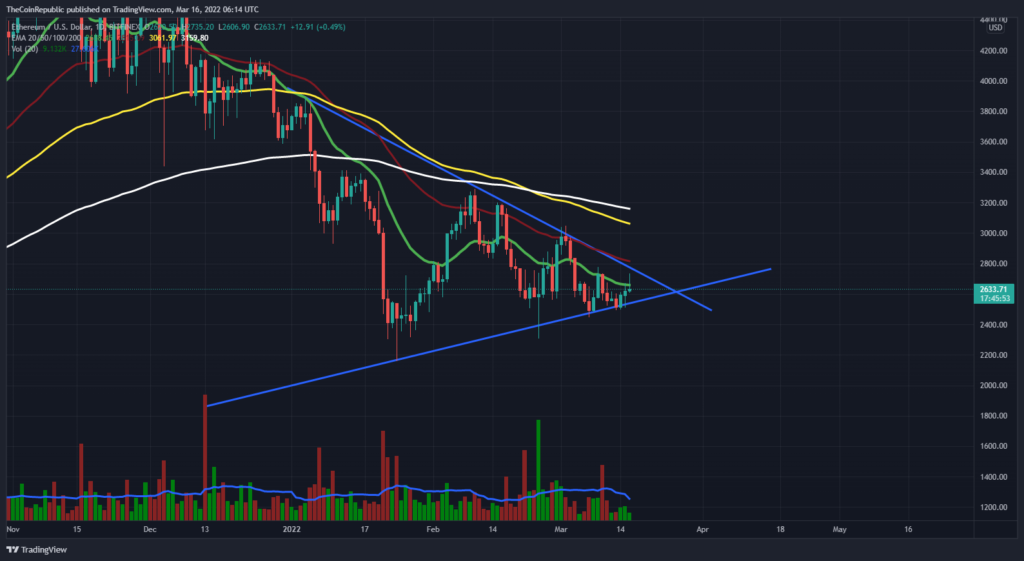
The volume to market cap ratio is 0.04815. ETH Coin has been consolidating inside a symmetrical triangle from the past few trading sessions. However, this time ETH coin looks determined to move upwards and break out of the symmetrical triangle pattern over the daily chart.
ETH price has recovered above 20 SMA and is now setting goals to recover above 50, 100, and 200-days Daily Moving Average. The volume change over the chart is below average and needs to grow as ETH coin has to sustain at the downward sloping line it is heading towards.
The highest and lowest hits by ETH in the last 24-hour period are $2735 and $2606, respectively. Ethereum investors need to wait for any directional change over the daily chart. Bulls need to sustain themselves at the neckline of a symmetrical triangle to prepare for the escape.
BCH/USD Chart Analysis
Bitcoin Cash (BCH) price has been trading inside a horizontal range-bound area after falling through a descending channel over the daily chart. BCH coin price is currently trading bullish below a downward sloping line and inside of a horizontally bounded region.
BCH needs to sustain at the downward sloping line to be completely bullish over the daily chart. BCH has been trading in the horizontal range of $362 and $260. However, BCH broke out of the psychological barrier of $300 today itself. BCH registered the highest hit of the last 24-hour at $302, failed to sustain at the higher level, and fell below $300 again. Also, it has seen below the $300 mark from last 4 consecutive trading sessions.
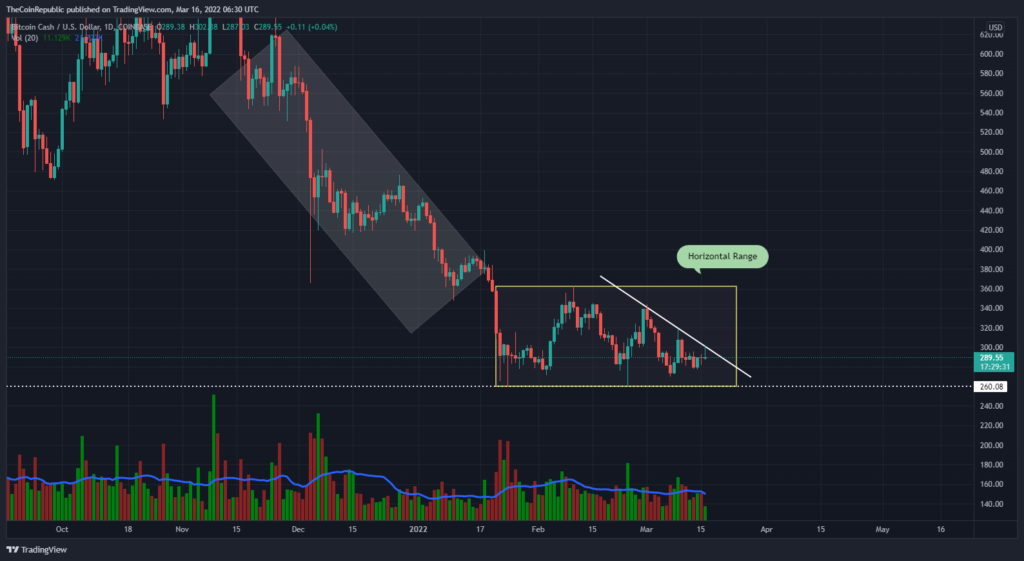
BCH Coin price is presently CMP at $290 and has gained 1.18% of its market capitalization in the last 24-hour period. Trading volume has slightly increased by 2.57% in the intraday trading session.
BCH coin has been consolidating inside a horizontal range-bound area and waiting to recover out of it. However, volume change over the chart is below average and needs to grow for BCH to escape the consolidation phase and adapt to a bullish rally with a strong breakout.
BCH investors need to wait until bulls sustain at the downward sloping line and turn BCH coin completely bullish over the daily chart.
GRT/USD Chart Analysis
The Graph cryptocurrency is experiencing short selling after a 3 day buying streak. GRT Coin price is in a strong uptrend from 13th March, got up from $0.317 crucial demand zone and currently struggles to sustain at the downward sloping line after gaining almost 46%.
GRT is presently CMP at $0.42 and has significantly gained upto 19% of its market capitalization in the last 24-hour period. Trading volume has also significantly increased by almost 150% in the intraday trading session.
GRT coin is in a strong bullish rally. However, currently, GRT is experiencing a short-selling as bulls are trying to sustain at the downward sloping line, and on the other hand, bears are trying to pull back.
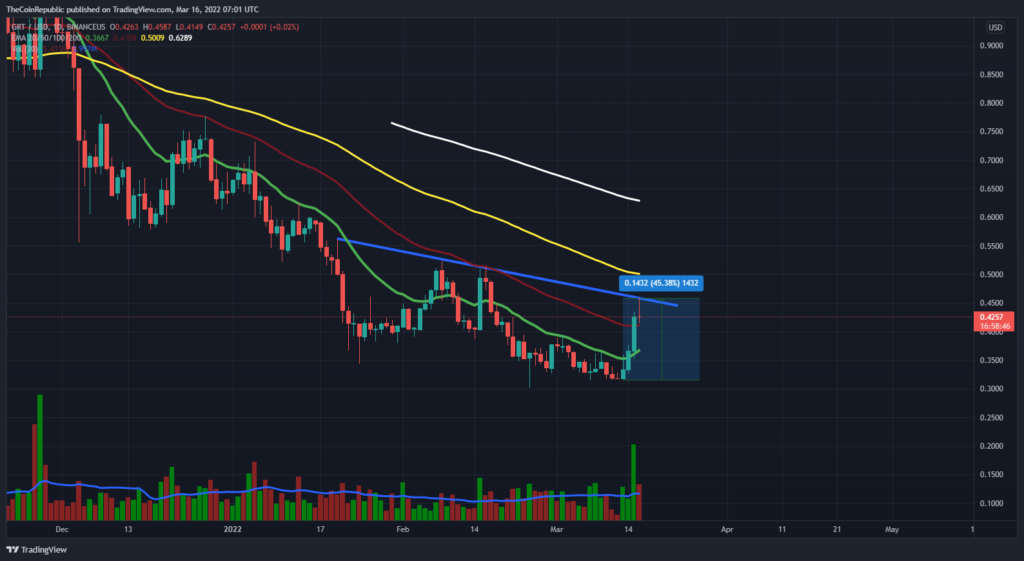
Volume to market cap ratio is 0.242. GRT investors are happy for a successful bullish rally and look determined to target $0.50 as its primary resistance level. GRT coin appears to be struggling at the neckline, but volume change over the chart is above average, and bulls need to get involved intensively to break out of the neckline.
GRT coin price has recovered above 20 and 50 SMA and setting aim for 100 and 200-days DMA. GRT investors need to wait for any directional change over the chart.
BAT/USD Chart analysis
Basic Attention token has gained more than 30% since it started the bullish rally. BAT coin is presently CMP at $0.81 and has gained around 15% of its market capitalization in the last 24-hour period. Trading Volume has significantly increased to 183.87% in the intraday trading session.
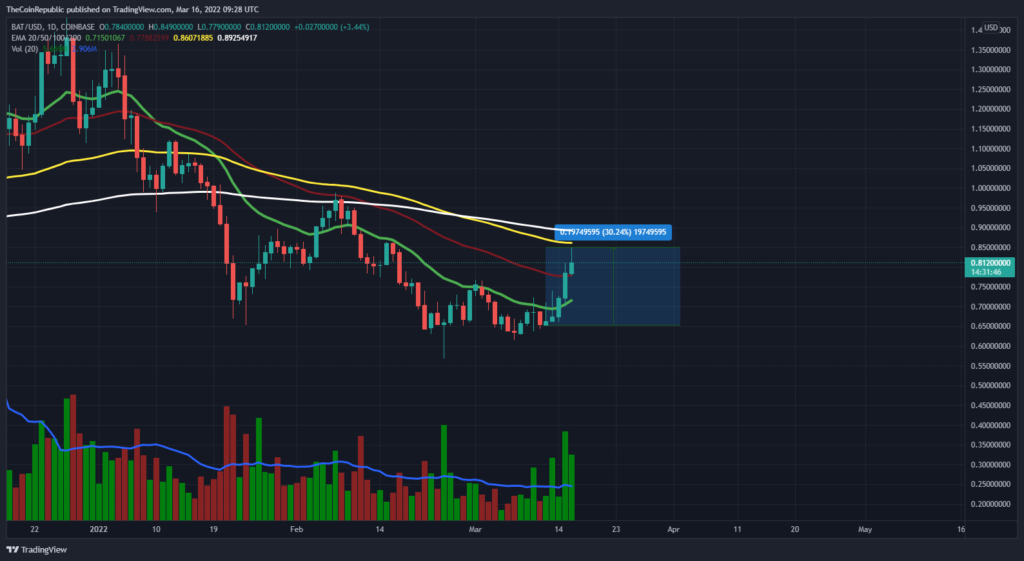
BAT coin price is in a bullish rally with strong bullish momentum over the daily chart. BAT got support at the crucial demand zone of $0.65 on 12th March and has continued its bullish rally since then.
BAT investors may aim for $1.00 as a primary resistance level. The crypto asset has recovered above 20 and 50 SMA and aims for 100 and 200-days DMA. Bears may try to interrupt in between with a strike of short-selling. BAT may fall before it reaches the primary resistance level.
Disclaimer
The views and opinions stated by the author, or any people named in this article, are for informational ideas only, and they do not establish the financial, investment, or other advice. Investing in or trading crypto assets comes with a risk of financial loss.

Andrew is a blockchain developer who developed his interest in cryptocurrencies while pursuing his post-graduation major in blockchain development. He is a keen observer of details and shares his passion for writing, along with coding. His backend knowledge about blockchain helps him give a unique perspective to his writing skills, and a reliable craft at explaining the concepts such as blockchain programming, languages and token minting. He also frequently shares technical details and performance indicators of ICOs and IDOs.


