
 Home
Home News
News
- The bulls are preparing for recovery, but the bears are not ready to leave the coin.
- The Crypto asset has fallen below 20, 50, 100 and 200-days Daily Moving Average.
- The ZEC/BTC pair is at 0.002963 with a loss of 0.59% in it.
Zcash is a decentralized cryptocurrency focused on privacy and anonymity. Zcash’s main advantage lies in its optional anonymity, which allows for a level of privacy unattainable with regular, pseudonymous cryptocurrencies like Bitcoin and Ethereum.
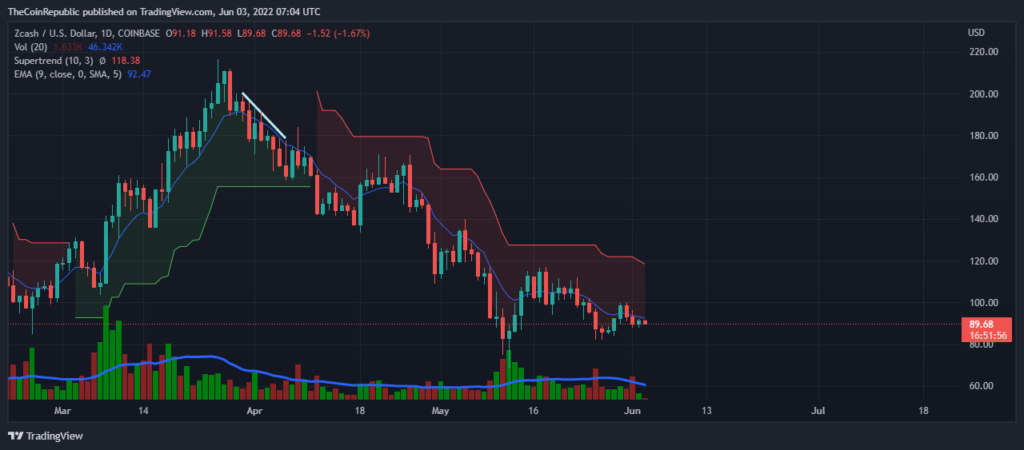
The ZEC price is again back to a downtrend after trying to recover. The bulls made the price to recover but as we know the bears will dominate the market and so they did. The ZEC bulls need to accumulate more power to make the coin recover. The volume is moving way below the average. The bulls need to apply constant support to make the coin recover. Currently the price is trading below the exponential moving average.
The current price for one ZEC coin is trading at $19.13 with a gain of 0.63% in its market capitalization in the last 24 hrs. The coin has a volume of 89 million with a loss of 32.49% in the 24 hrs trading session and market cap of 1.3 billion which is at a gain of 0.53% in it. The volume market cap ratio is 0.06887.
Short term Analysis
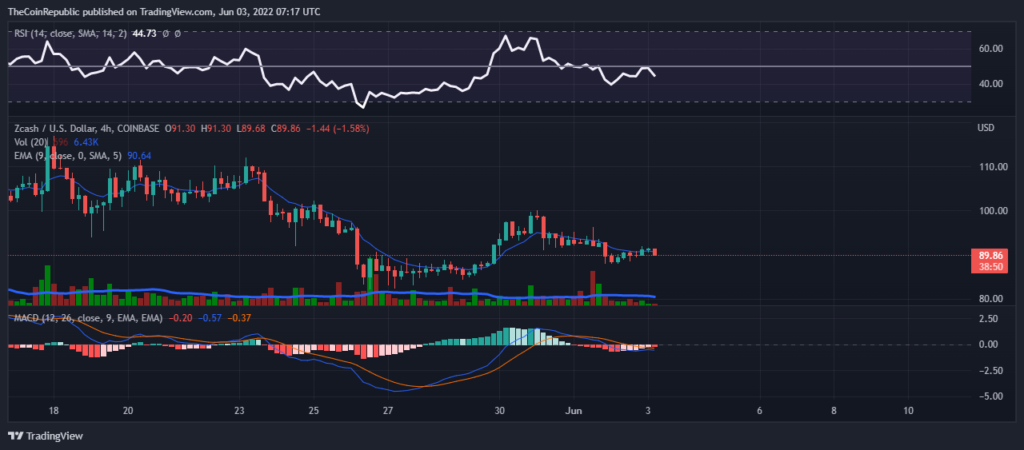
While analyzing the graph for a short term (4 hrs) we can observe a same downtrend. We can see that the bulls are trying to rescue the token here but the bears are dominating so no significant green move can be observed.
ALSO READ – Can Immutable X be the savior for Yuga Labs from broken “Etherscan”
Let’s see what technical indicators have for us.
The relative strength index is moving toward the oversold region indicating the increase in selling. The RSI value is nearly equal to 45.
The MACD line is moving below the MACD signal line after the negative cross and the histograms are rising red supporting the bearish rally.
Conclusion
The ZEC price is again back to a downtrend after trying to recover. The downtrend can be observed across all time horizons. The short term graph closely shows the battle between bulls and bears to take over the market. The technical indicators are indicating a bearish rally further.
Technical levels
Resistance levels:$95 and $100
Support levels: $85 and $80
Disclaimer
The views and opinions stated by the author, or any people named in this article, are for informational ideas only, and they do not establish the financial, investment, or other advice. Investing in or trading crypto assets comes with a risk of financial loss.
Steve Anderson is an Australian crypto enthusiast. He is a specialist in management and trading for over 5 years. Steve has worked as a crypto trader, he loves learning about decentralisation, understanding the true potential of the blockchain.


