
 Home
Home News
News

- Kusama’s price is trying to surge towards the upper price range of the consolidation phase over the daily price chart.
- KSM crypto has recovered above 20 and 50 EMA.
- The pair of KSM/BTC is at 0.002797 BTC with an intraday gain of 3.16%.
Kusama is currently seeking to build significant upward momentum on the chart by trading at 2021 lows. By receiving support from bulls, the token is aiming to emerge from the consolidation period. KSM coin needs to draw in more buyers in order to exit the consolidation phase. Before becoming trapped inside a range-bound region, the KSM token initially descended via three lowering peaks. KSM needs to break out of the consolidation period in order to keep from tumbling farther down the chart.

Kusama’s price has increased 3.91 % of its market capitalization in the previous 24 hours and is currently CMP at $64.95 at this time. However, during the intraday trading session, trading volume has marginally fallen by 13%. This demonstrates that even though KSM is now behind and needs regular assistance from bulls, buyers are still stockpiling to prevent further losses. The volume to market cap ratio is 0.05769.

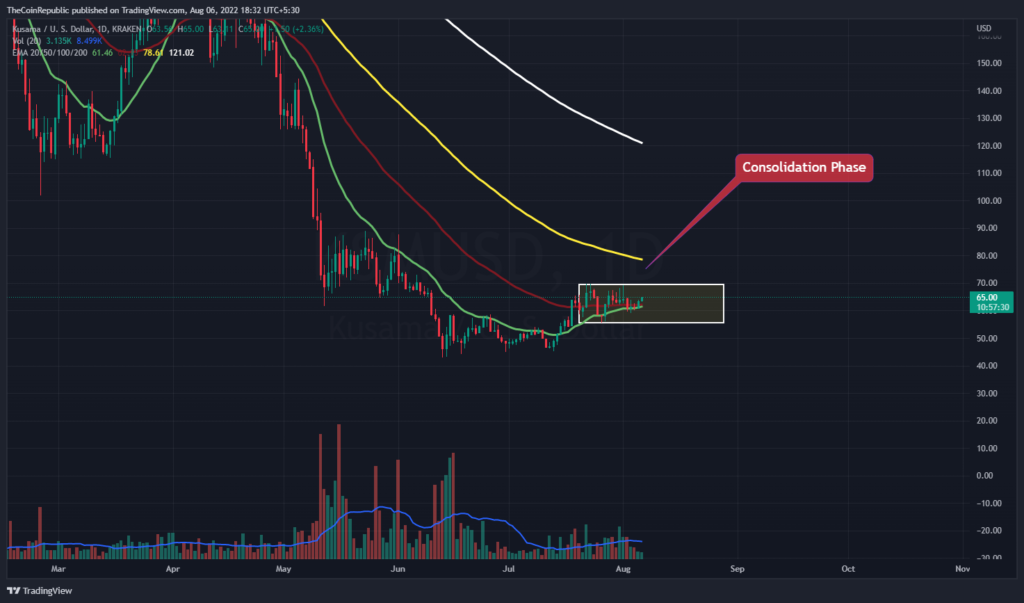
The KSM coin price is seeking to exit a consolidation phase on the daily chart. The token has to acquire support from bulls in order to break the pattern. Investors in KSM should monitor the daily chart for any changes in direction. Before taking any judgments regarding the token’s velocity, KSM investors must wait. As volume change is below the average line and must increase to be registered to indicate the breakout of the KSM token, the volume on the chart is steadily dropping.
What do Technical Indicators suggest about KSM?
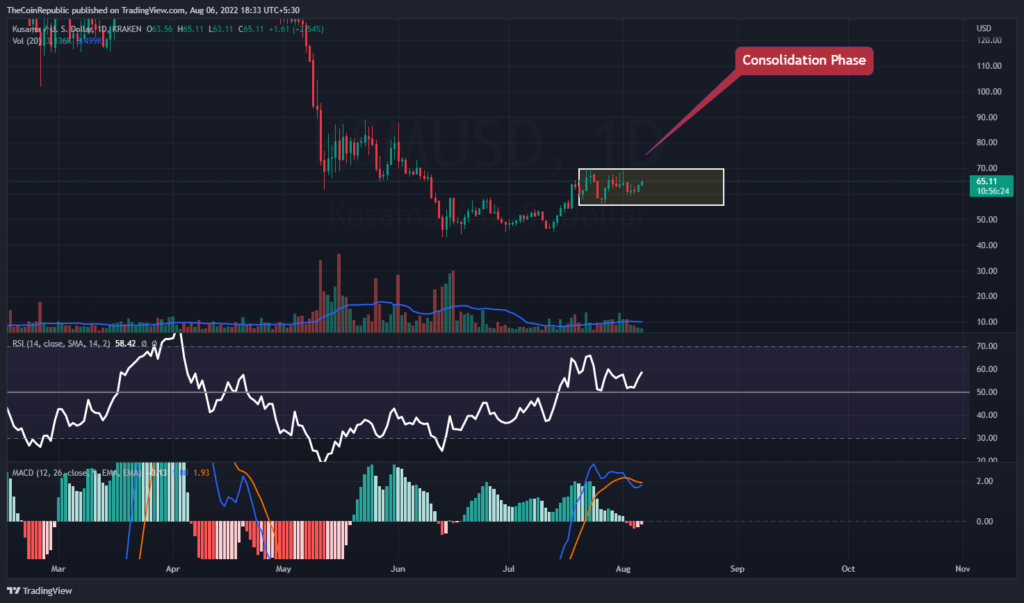
Technical indicators suggest the uptrend momentum of the KSM coin. Relative Strength Index showcases the uptrend momentum of KSM coin. RSI is at 58 and is approaching overbought territory. MACD exhibits the bullish momentum of KSM coin. The MACD line is about to cross the signal line upwards resulting in a positive crossover.
Conclusion
Kusama is currently seeking to build significant upward momentum on the chart by trading at 2021 lows. By receiving support from bulls, the token is aiming to emerge from the consolidation period. KSM coin needs to draw in more buyers in order to exit the consolidation phase. Before becoming trapped inside a range-bound region, the KSM token initially descended via three lowering peaks. As volume change is below the average line and must increase to be registered to indicate the breakout of the KSM token, the volume on the chart is steadily dropping. Technical indicators suggest the uptrend momentum of KSM coin.
Technical Levels
Support Levels: $60.00 and $55.00
Resistance Levels: $68.00 and $70.00
Disclaimer
The views and opinions stated by the author, or any people named in this article, are for informational ideas only, and they do not establish the financial, investment, or other advice. Investing in or trading crypto assets comes with a risk of financial loss.

Andrew is a blockchain developer who developed his interest in cryptocurrencies while pursuing his post-graduation major in blockchain development. He is a keen observer of details and shares his passion for writing, along with coding. His backend knowledge about blockchain helps him give a unique perspective to his writing skills, and a reliable craft at explaining the concepts such as blockchain programming, languages and token minting. He also frequently shares technical details and performance indicators of ICOs and IDOs.


