
 Home
Home News
News

- eCash price tried to escape the consolidation phase but bulls failed to sustain and the token stuck back inside the range.
- XEC crypto stands at 53rd rank over CoinMarketCap and is currently approximated at $0.0000446.
- The pair of XEC/BTC is at 0.000000002252 BTC with an intraday gain of 0.37%.
The price of eCash has been stable inside the horizontal range-bound zone since June 23. The token has been attempting to exit the consolidation phase, but bulls have consistently been unable to retain gains at the consolidation phase’s level. The bullish attitude of XEC indicates that they are focused on documenting the token’s breakthrough from the horizontal zone this time. The token’s price has stayed the same at $0.000035 to $0.000050, nevertheless. XEC’s price is currently soaring into the consolidation phase’s top range and is strongly trending upward. XEC bulls must hold onto their position at the trendline in order to allow the token to move above the caged region.

eCash’s estimated price is currently $0.0000446, and its market capitalization dropped by 1.14% the day before. The number of trades, however, decreased by 62.22% during the intraday trading session. This can be a sign that bears are attempting to stockpile in anticipation of the XEC cryptocurrency’s price drop. Volume to market cap ratio is 0.02351.

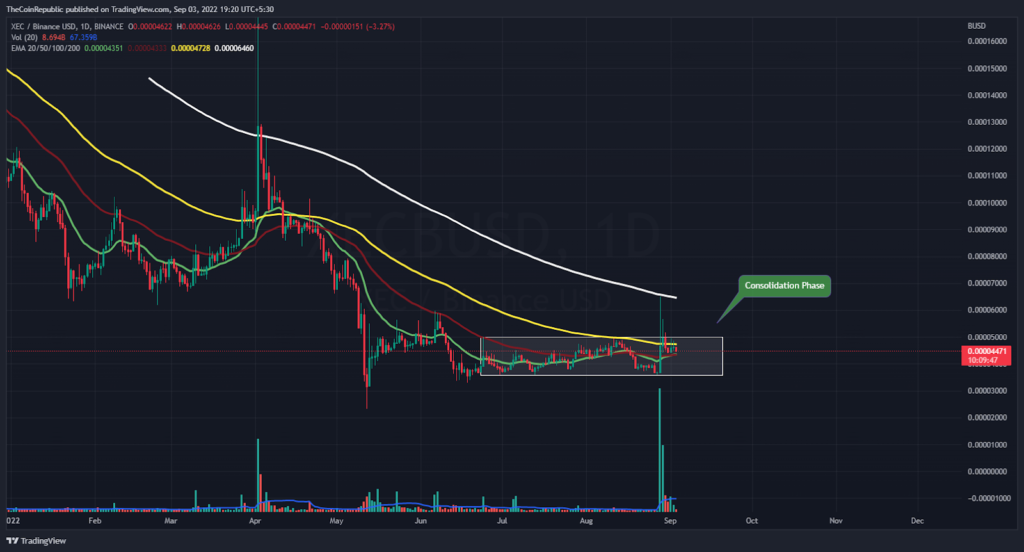
The price of XEC is rising toward the upper trendline of the consolidation phase on the daily price chart. Bulls must assemble at XEC to witness the breakout of the token. However, because volume suggests that the rate of accumulation is small, bears could halt the XEC coin’s upward momentum at any point. Bulls in XEC need to acquire swiftly if they want to avoid falling into any bearish traps.
What do Technical Indicators suggest about XEC?
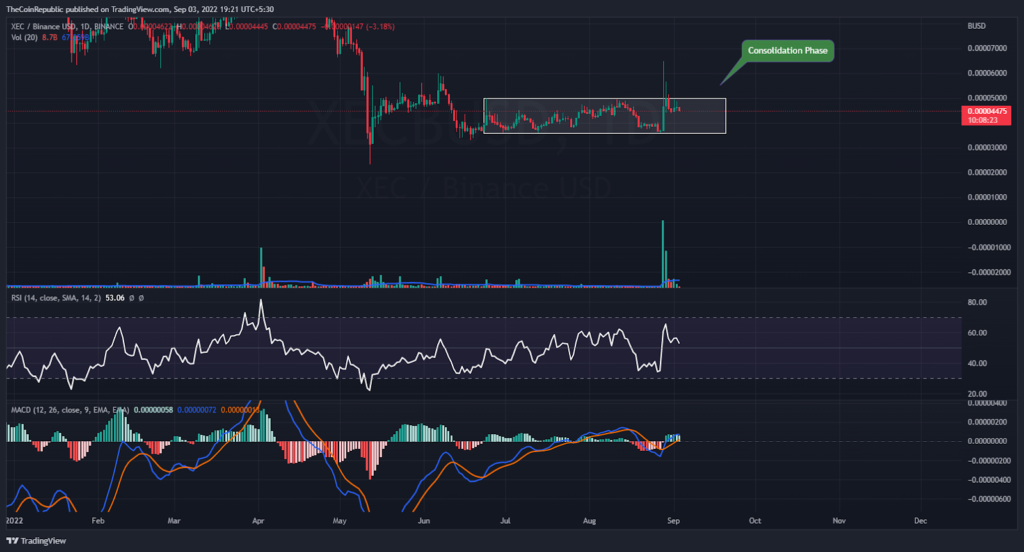
The XEC coin price is striving to hold at the current level during the consolidation phase on the daily chart. The momentum of the XEC coin’s downward trend is shown by technical indicators.
Relative Strength Index showcases the downtrend momentum of XEC coin. RSI is at 53 and is hovering above neutrality. MACD exhibits the consolidation phase of the XEC coin. The MACD line is above the signal line. XEC investors need to wait for any directional change over the daily chart.
Conclusion
The price of eCash has been stable inside the horizontal range-bound zone since June 23. The token has been attempting to exit the consolidation phase, but bulls have consistently been unable to retain gains at the consolidation phase’s level. The bullish attitude of XEC indicates that they are focused on documenting the token’s breakthrough from the horizontal zone this time. The token’s price has stayed the same at $0.000035 to $0.000050, nevertheless. However, because volume suggests that the rate of accumulation is small, bears could halt the XEC coin’s upward momentum at any point. Bulls in XEC need to acquire swiftly if they want to avoid falling into any bearish traps. The momentum of the XEC coin’s downward trend is shown by technical indicators. The MACD line is above the signal line. XEC investors need to wait for any directional change over the daily chart.
Technical Levels
Support Levels: $0.000043 and $0.000035
Resistance Levels: $0.000048 and $0.000050
Disclaimer
The views and opinions stated by the author, or any people named in this article, are for informational ideas only, and they do not establish the financial, investment, or other advice. Investing in or trading crypto assets comes with a risk of financial loss.

Nancy J. Allen is a crypto enthusiast, with a major in macroeconomics and minor in business statistics. She believes that cryptocurrencies inspire people to be their own banks, and step aside from traditional monetary exchange systems. She is also intrigued by blockchain technology and its functioning. She frequently researches, and posts content on the top altcoins, their theoretical working principles and technical price predictions.


